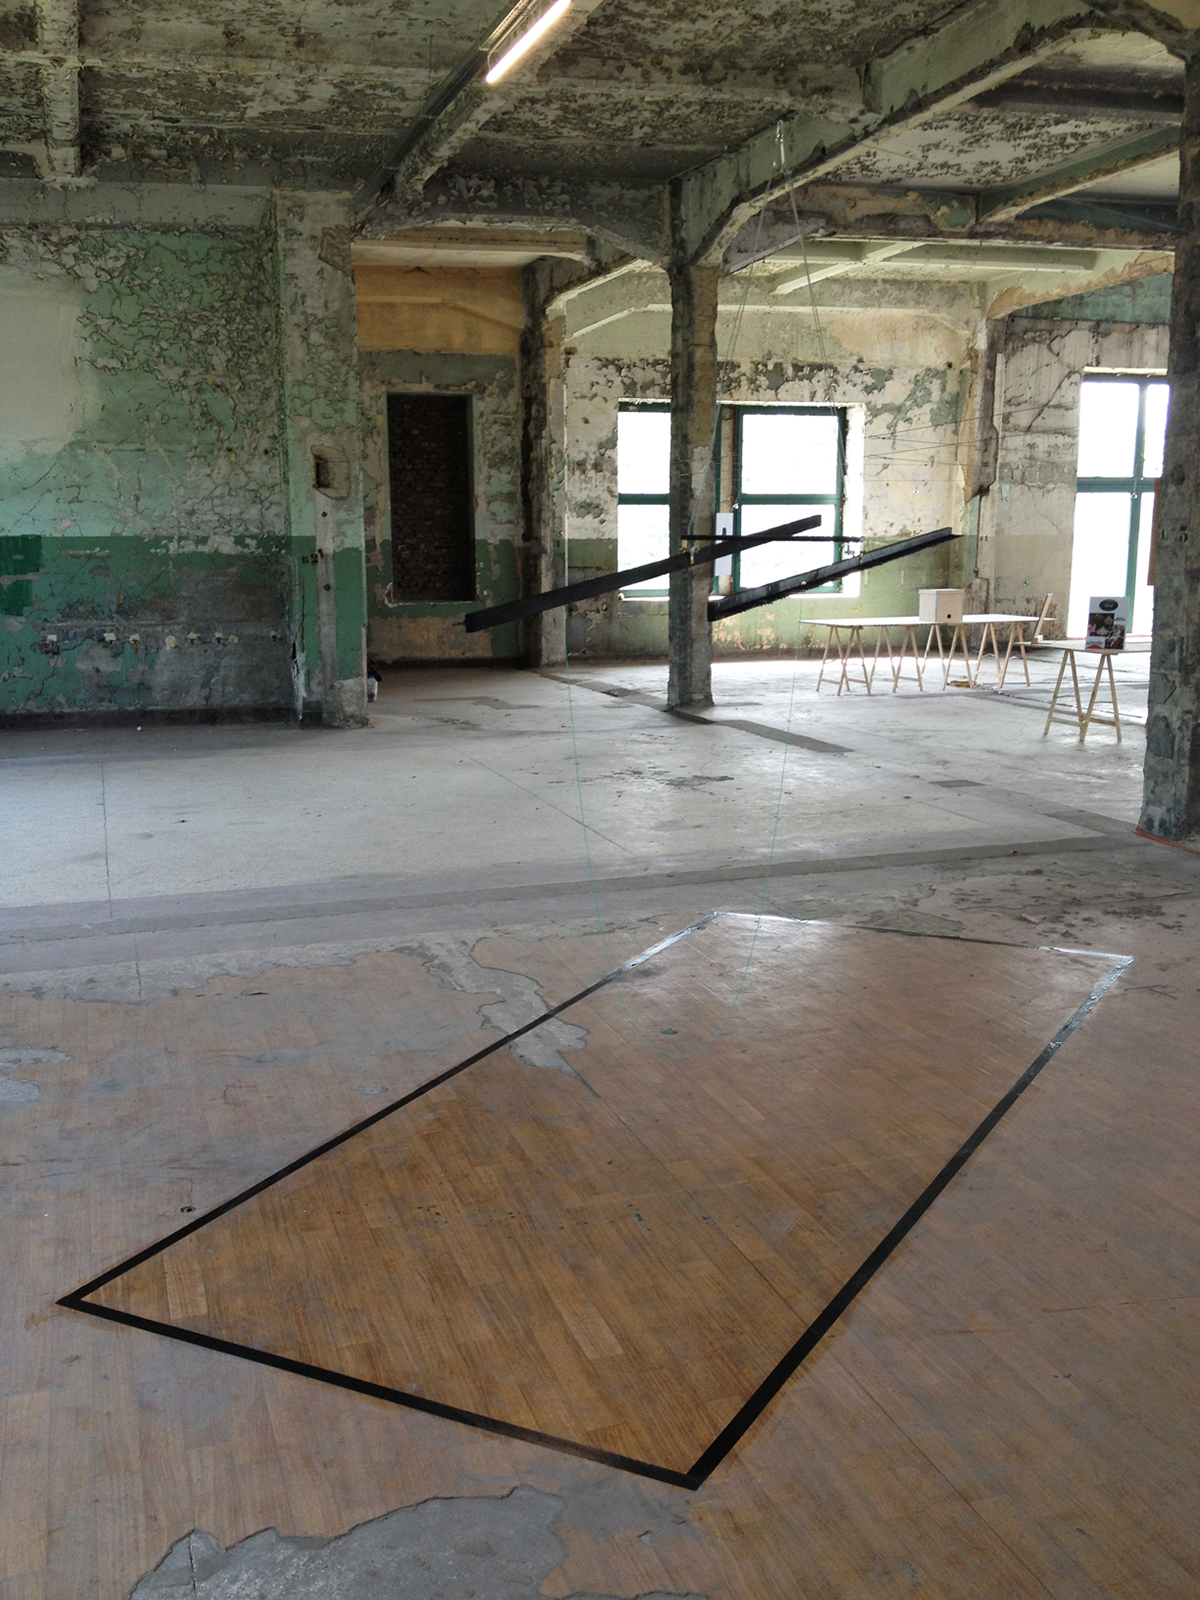
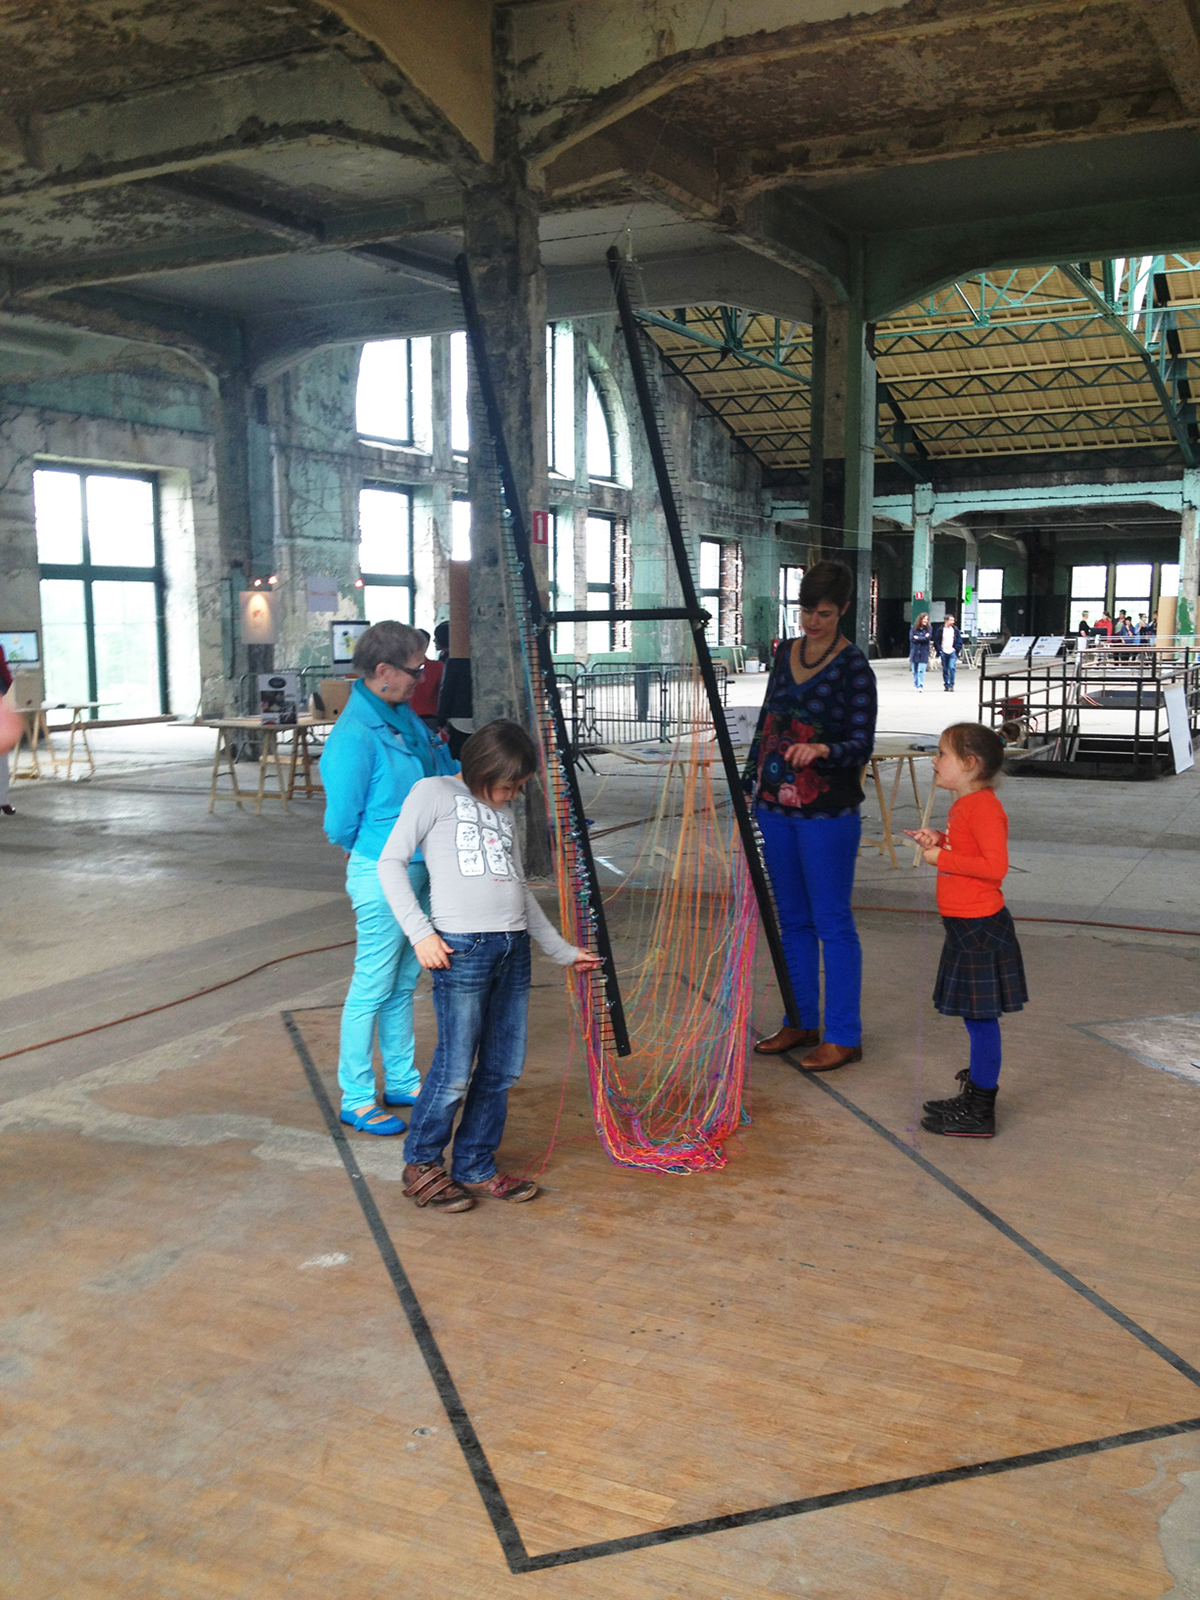
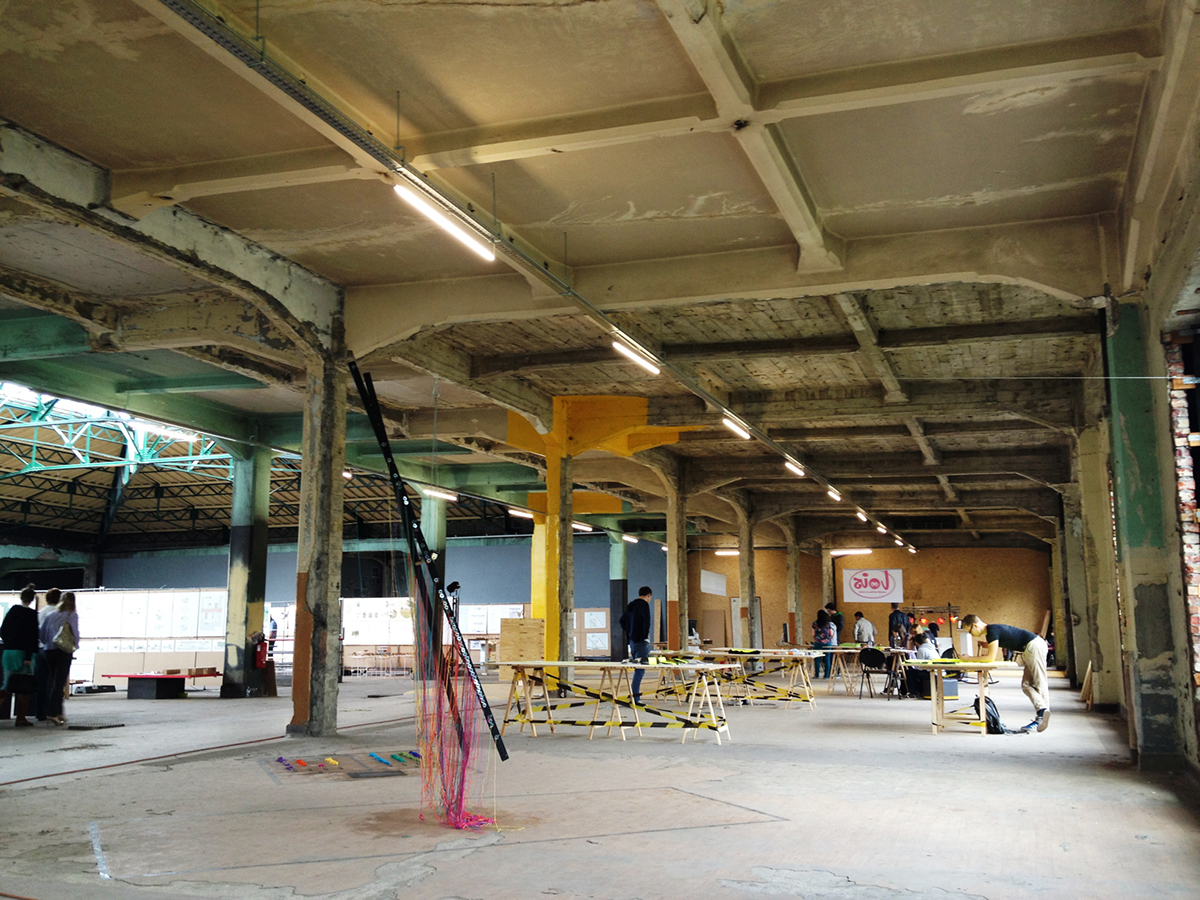
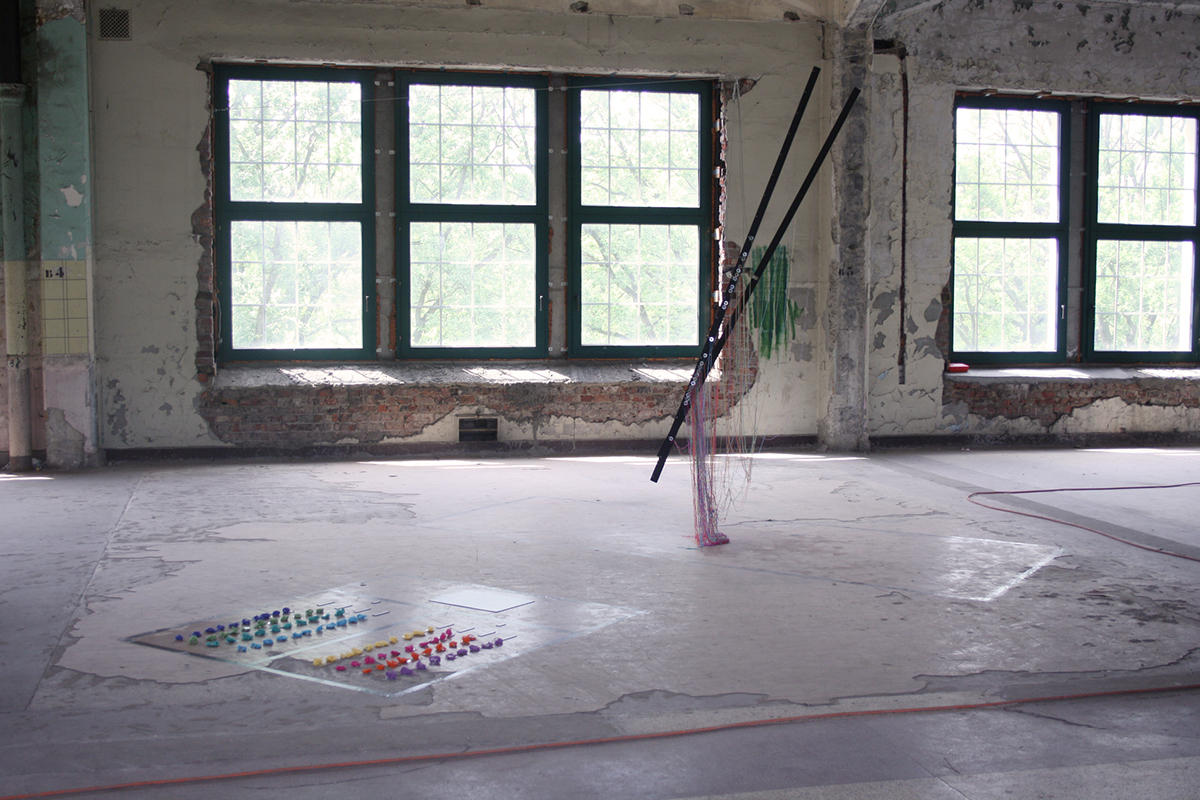
This project is an interactive, three-dimensional data visualization.
The public adds their own data to the installation.
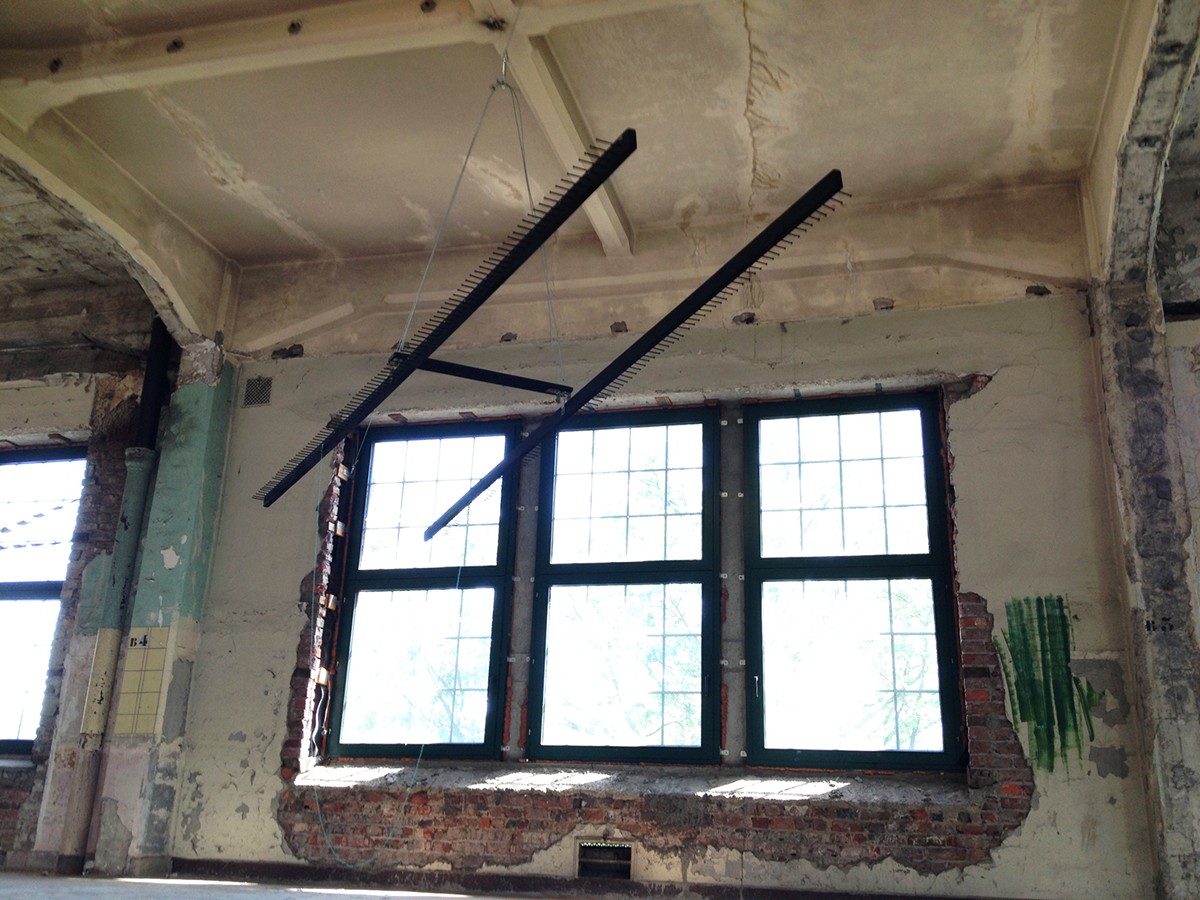
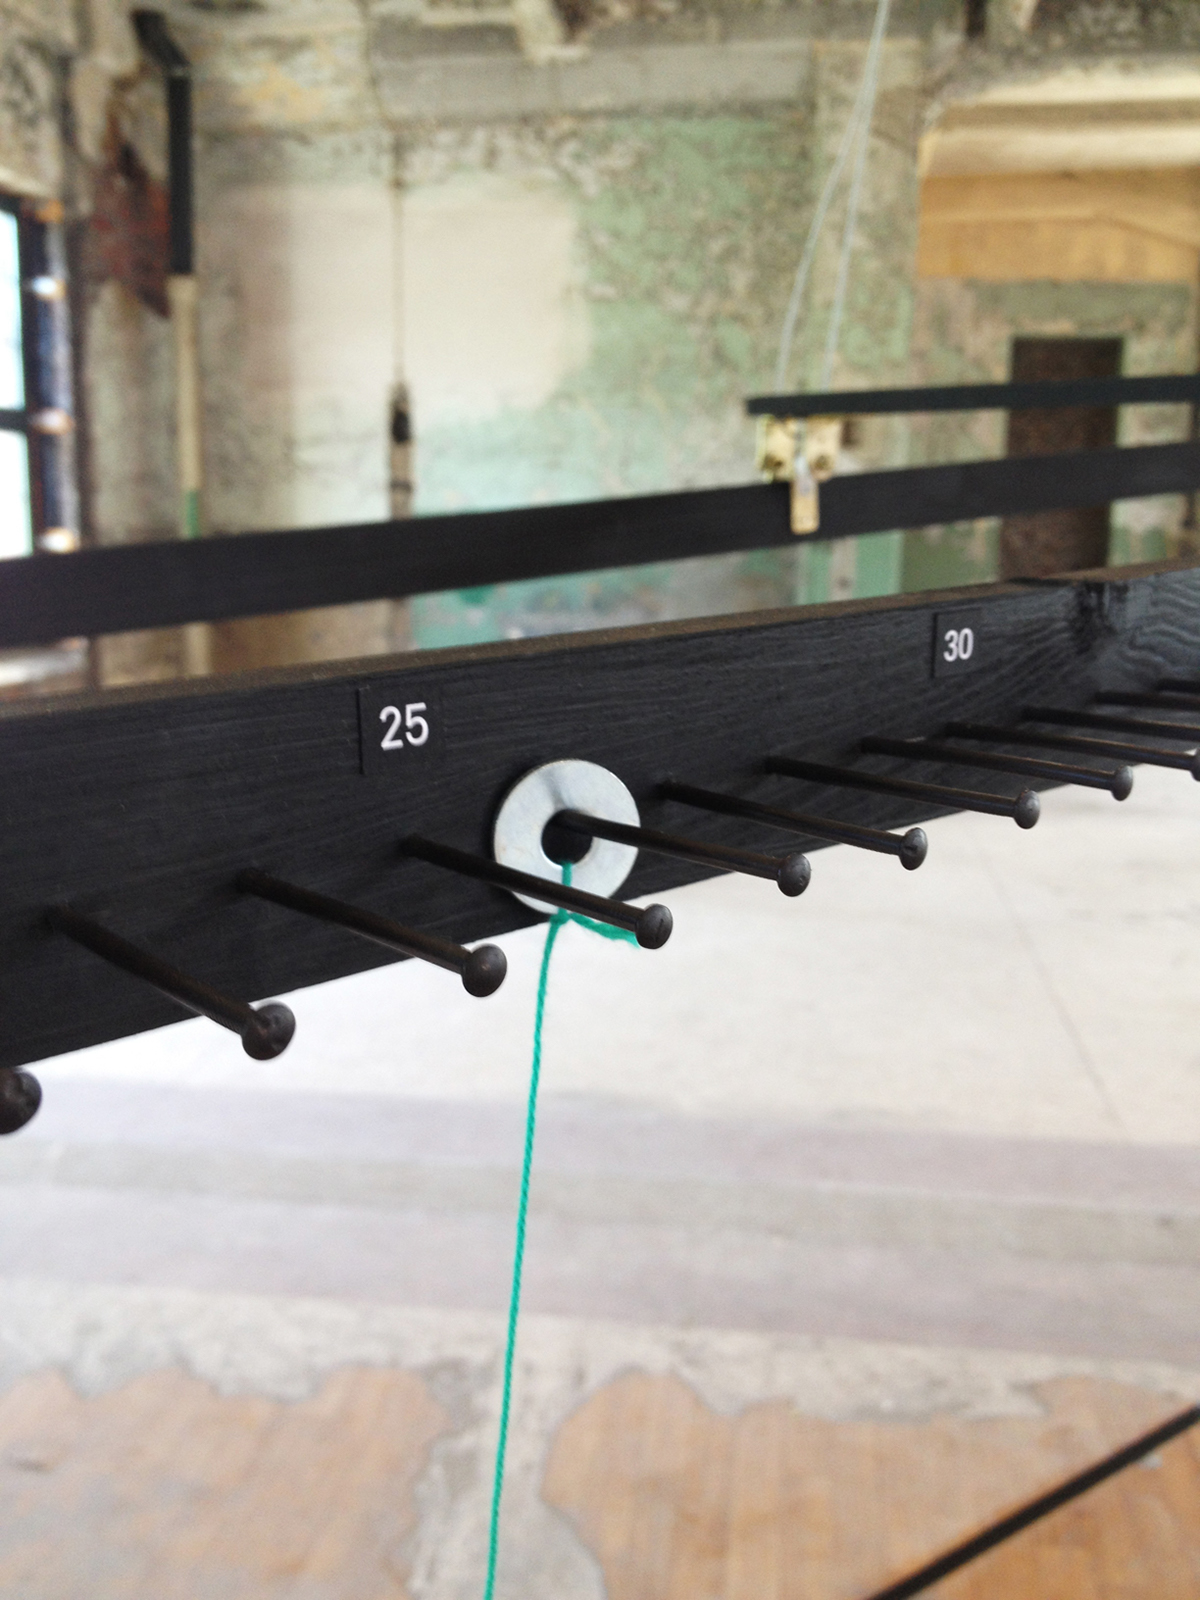
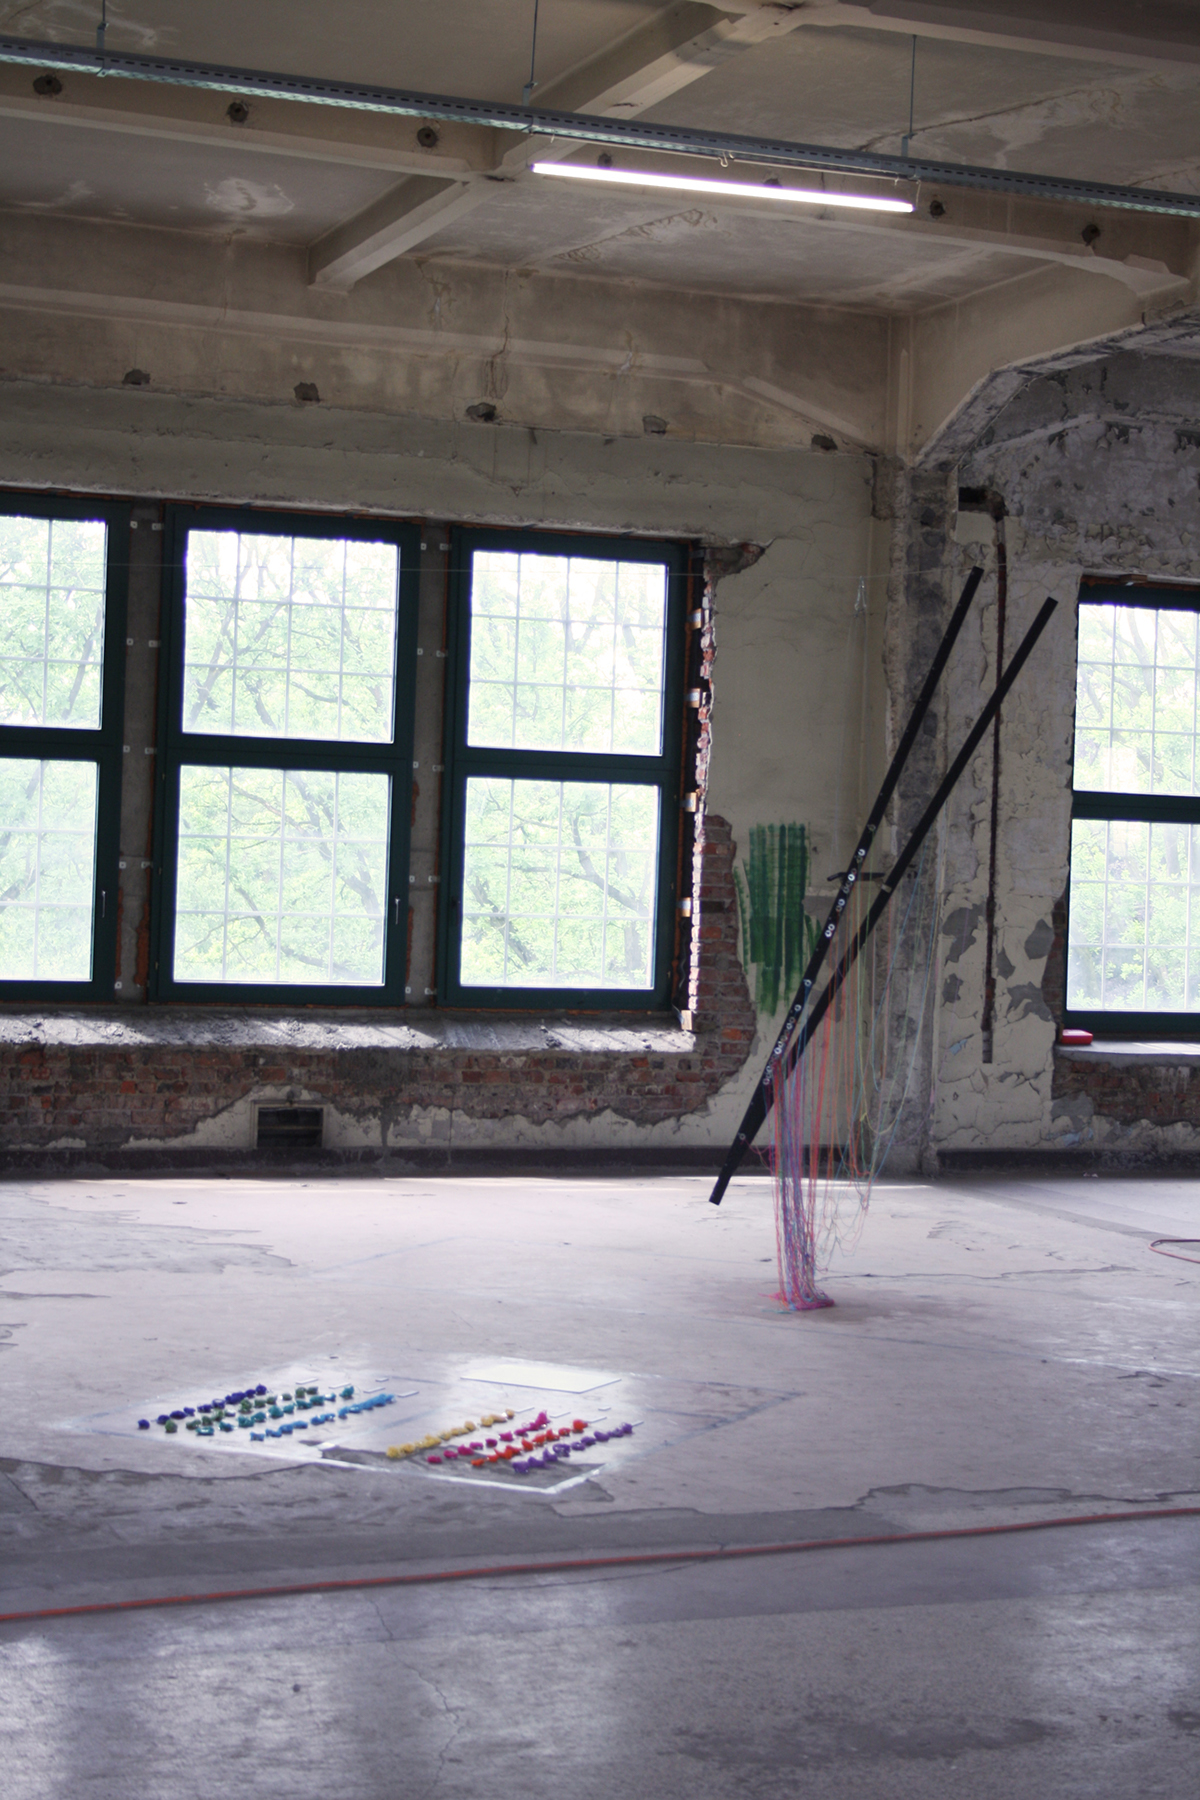
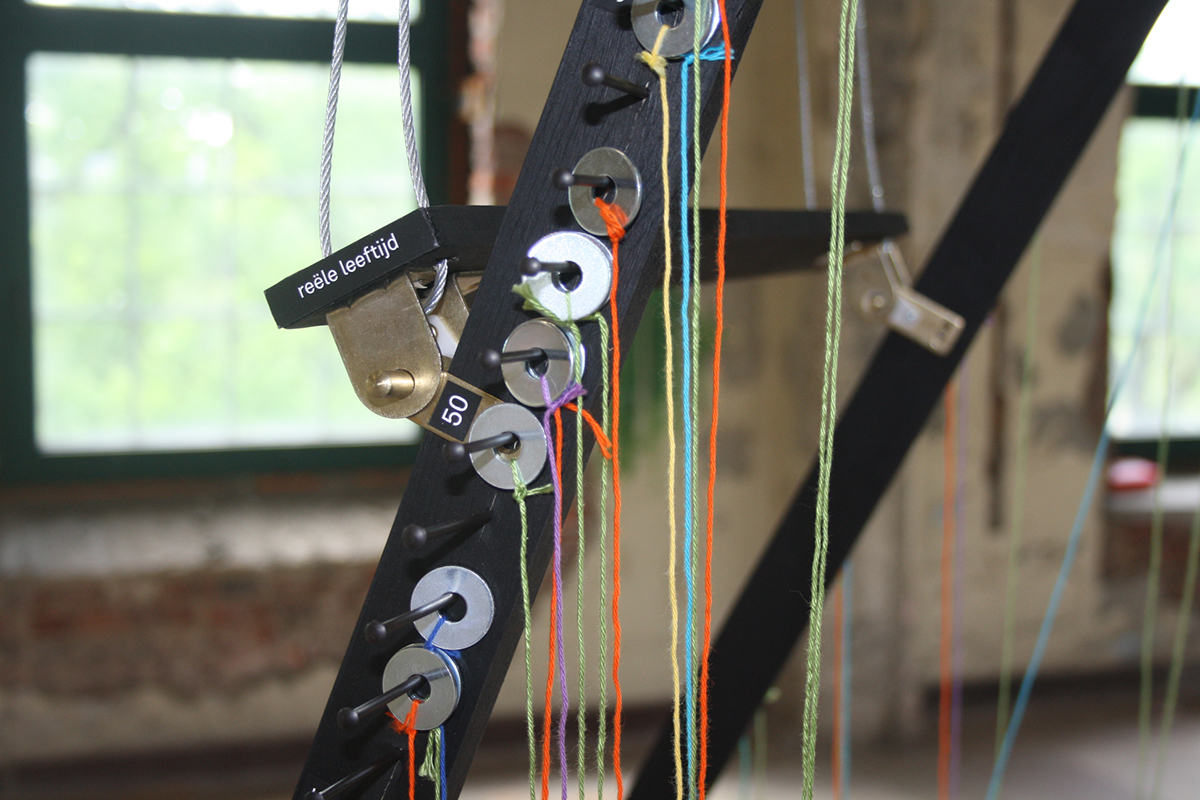
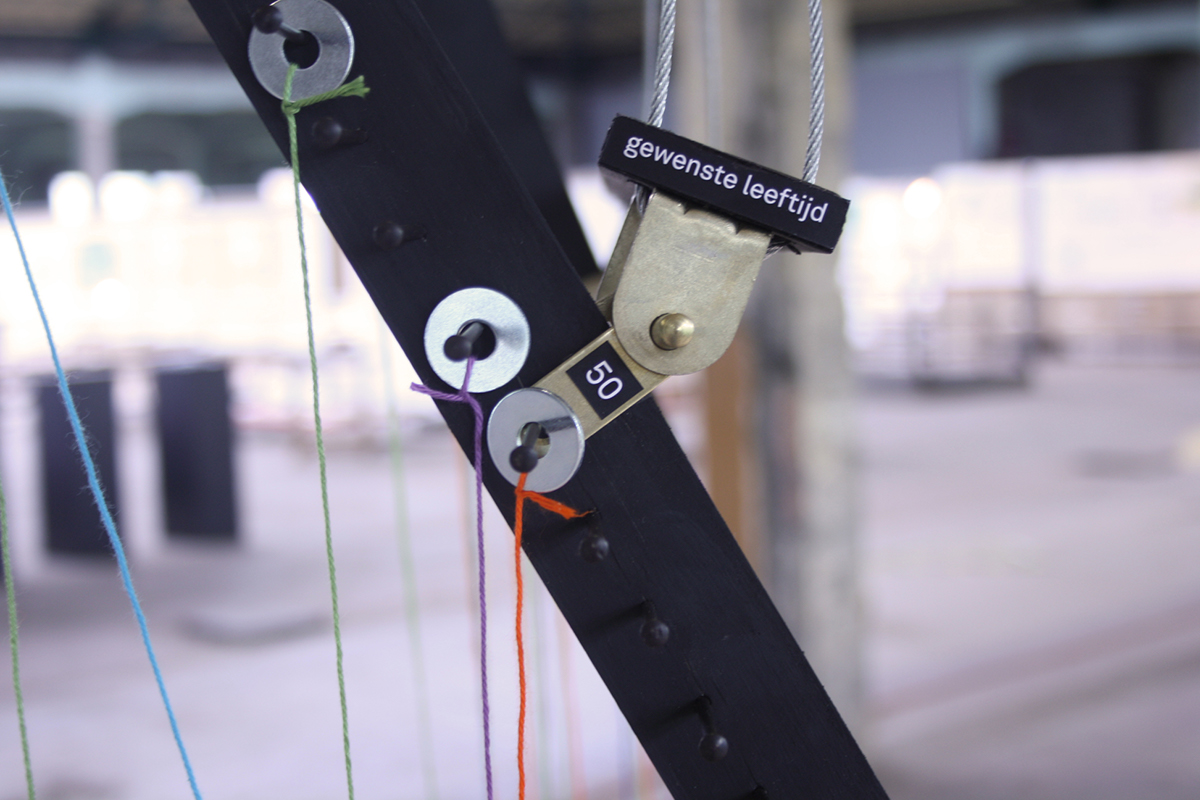
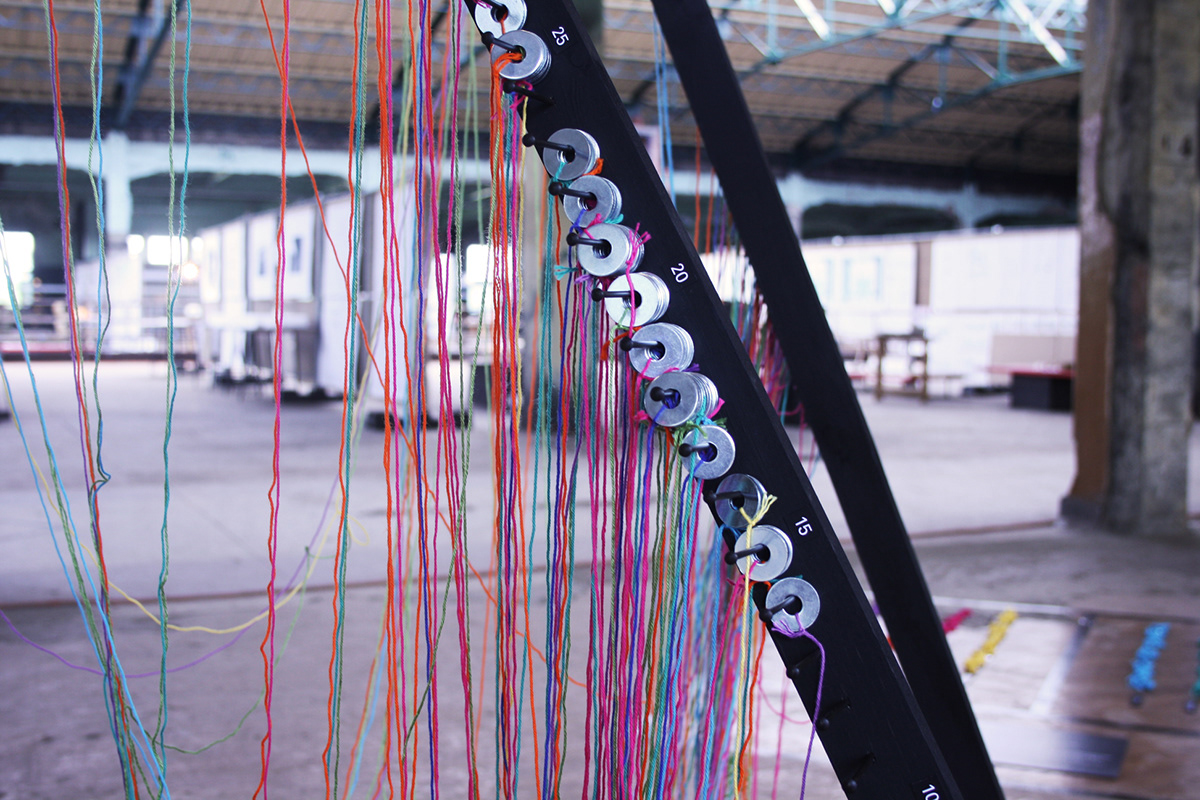
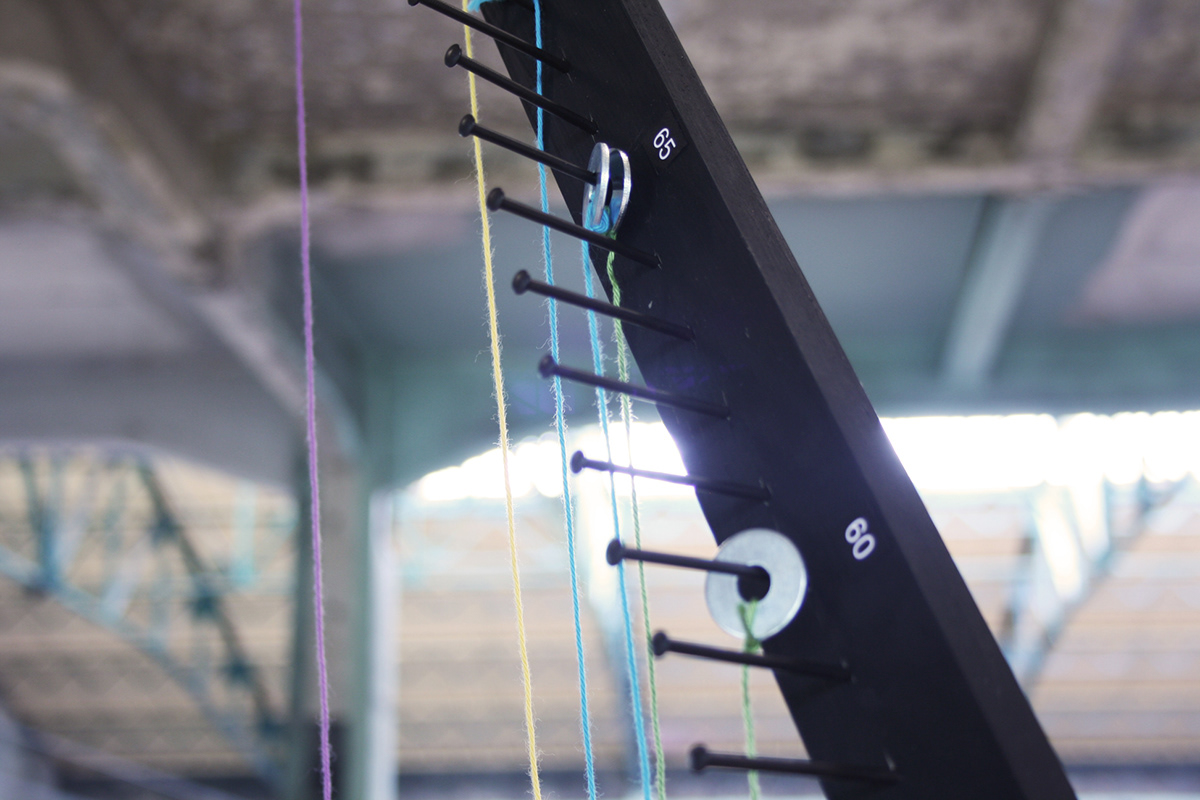
This can be done by connecting the two beams with a string. The first beam symbolizes your real age (how old you really are). The other beam symbolizes the preferred age (how old would you want to be if you could stop the time for a while?).
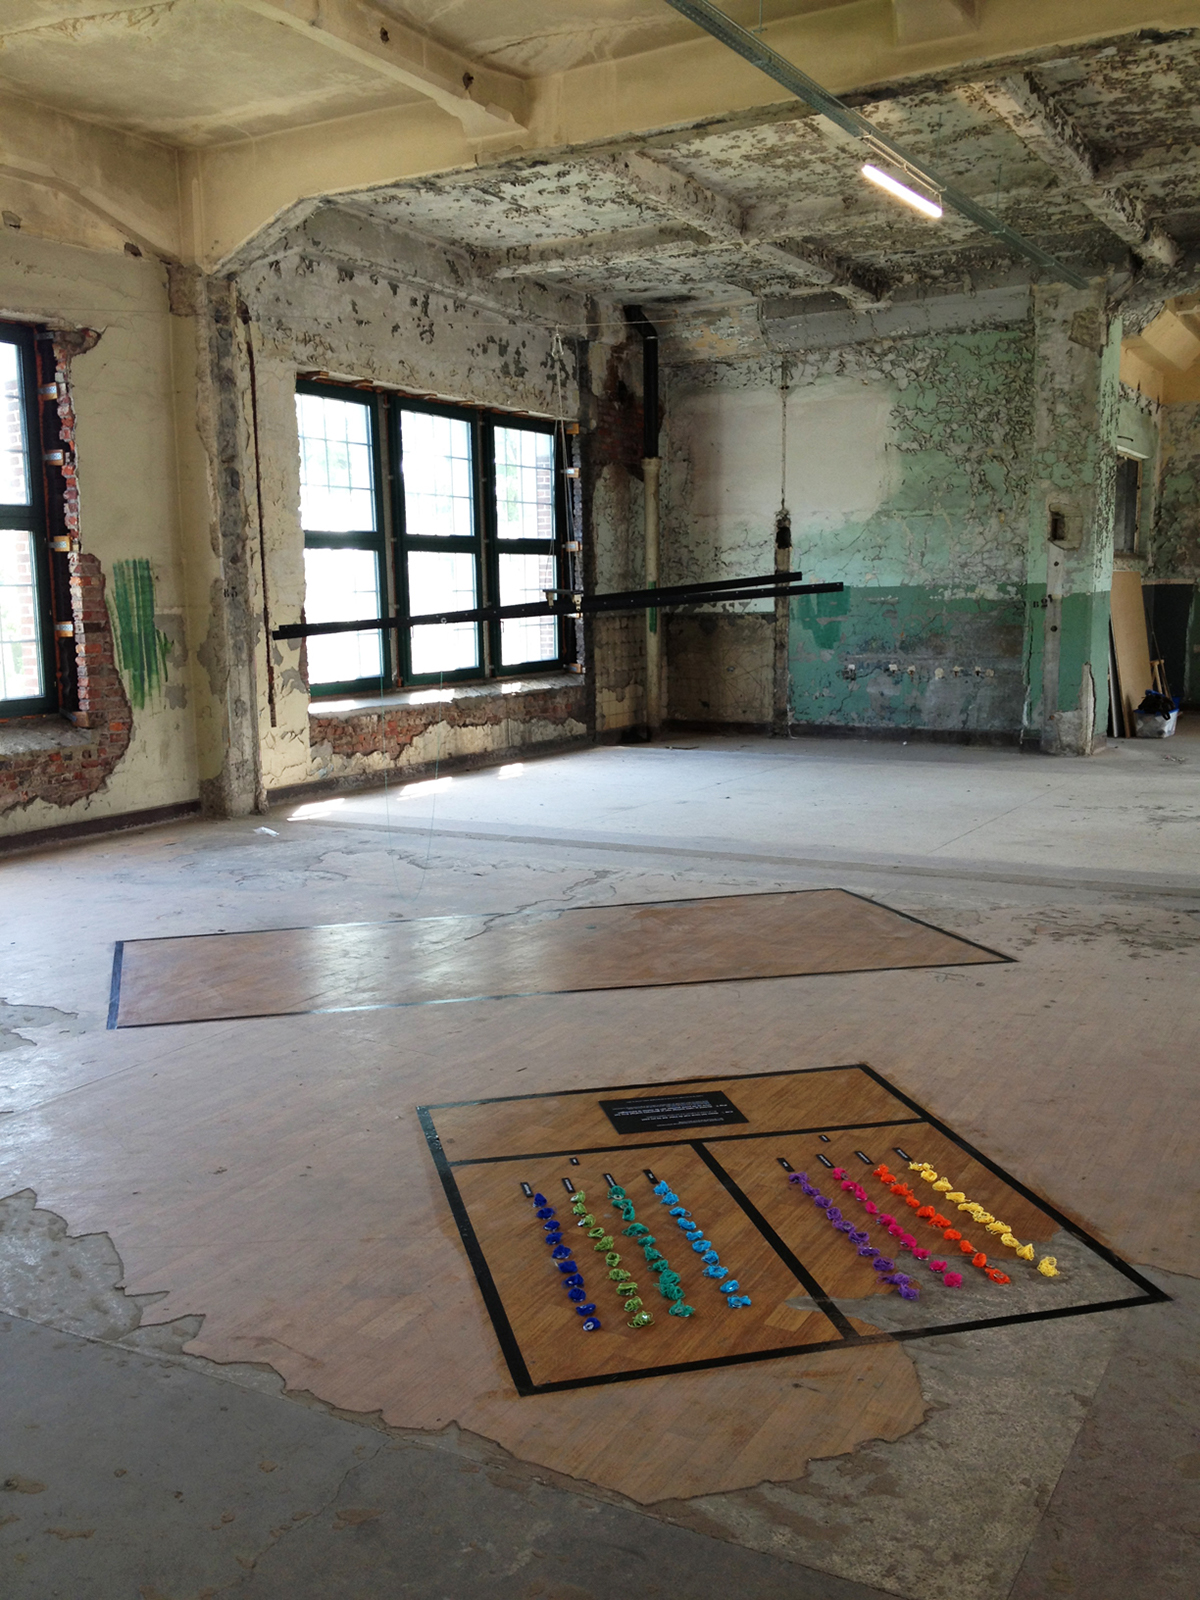
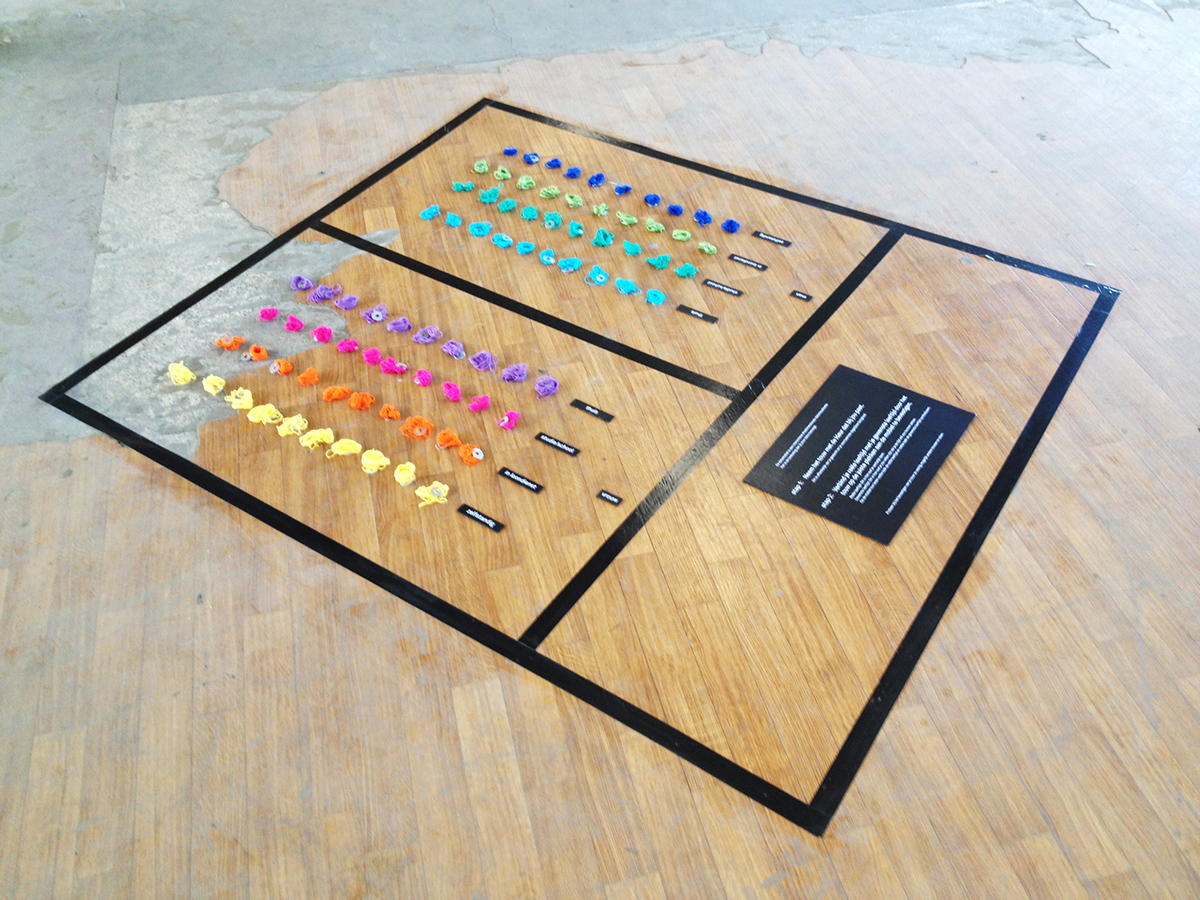
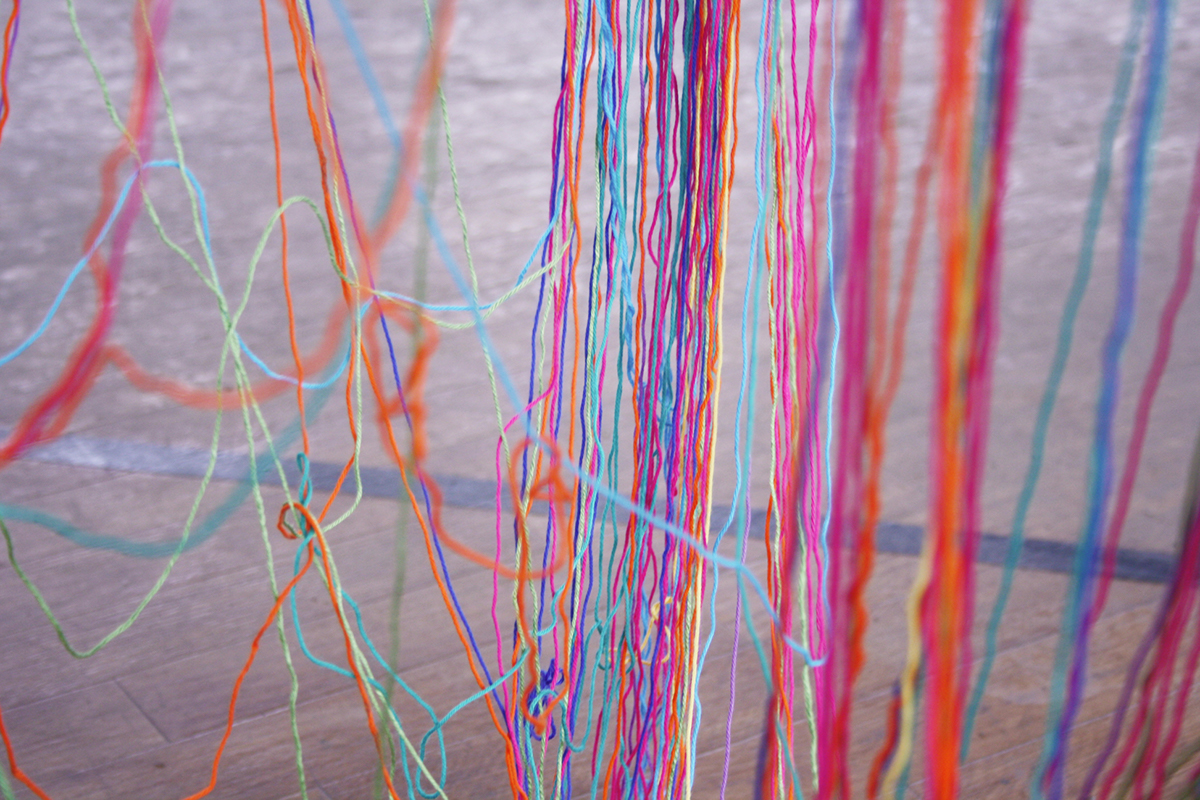
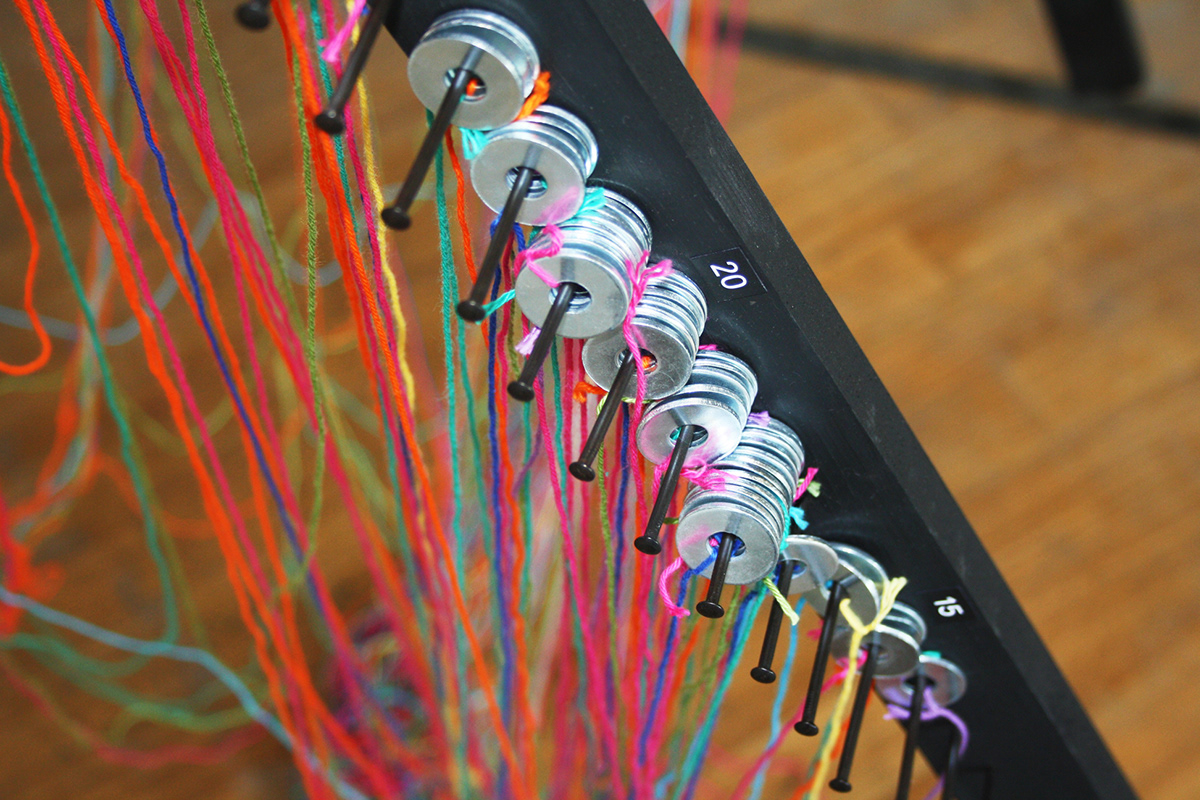
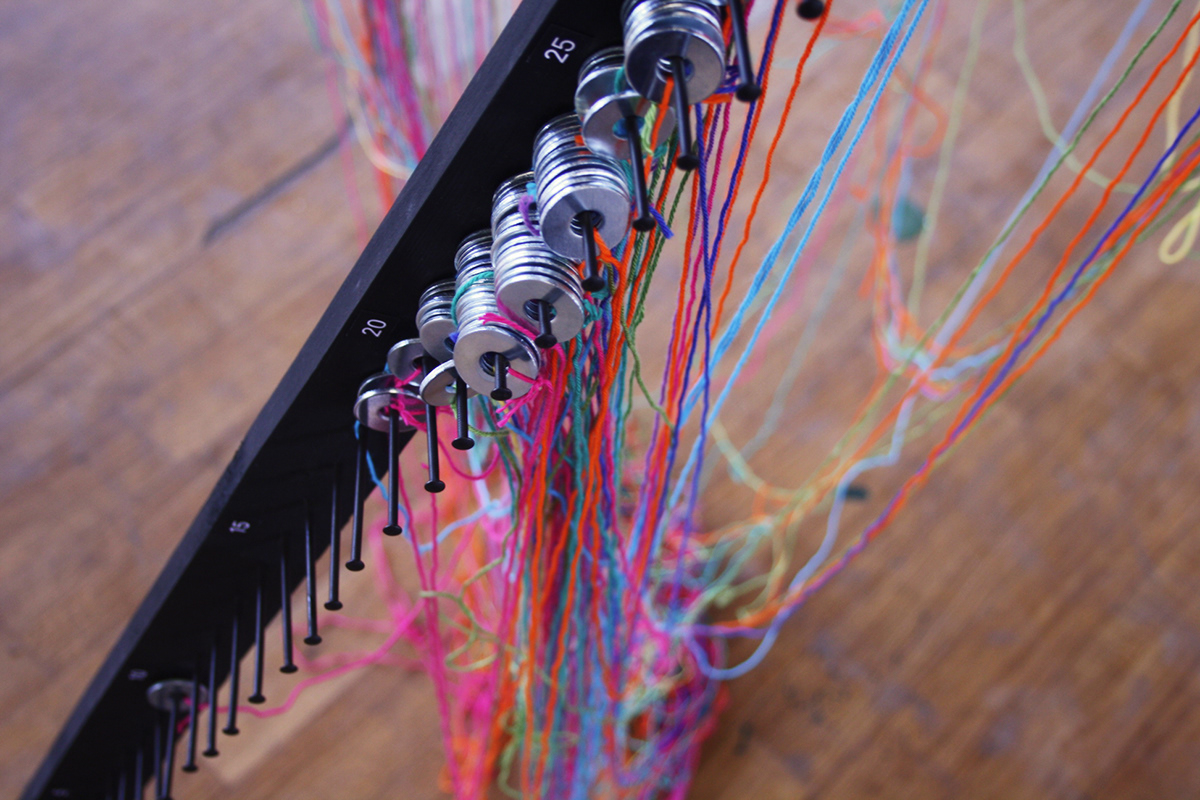
The colors of the strings show the sexes and daily activities:
Yellow: female – at home
Magenta: female – study/at school
Orange: female – employed
Purple: female – own business
Light blue: male – at home
Cyan: male – study/at school
Green: male – employed
Dark blue: male – own business
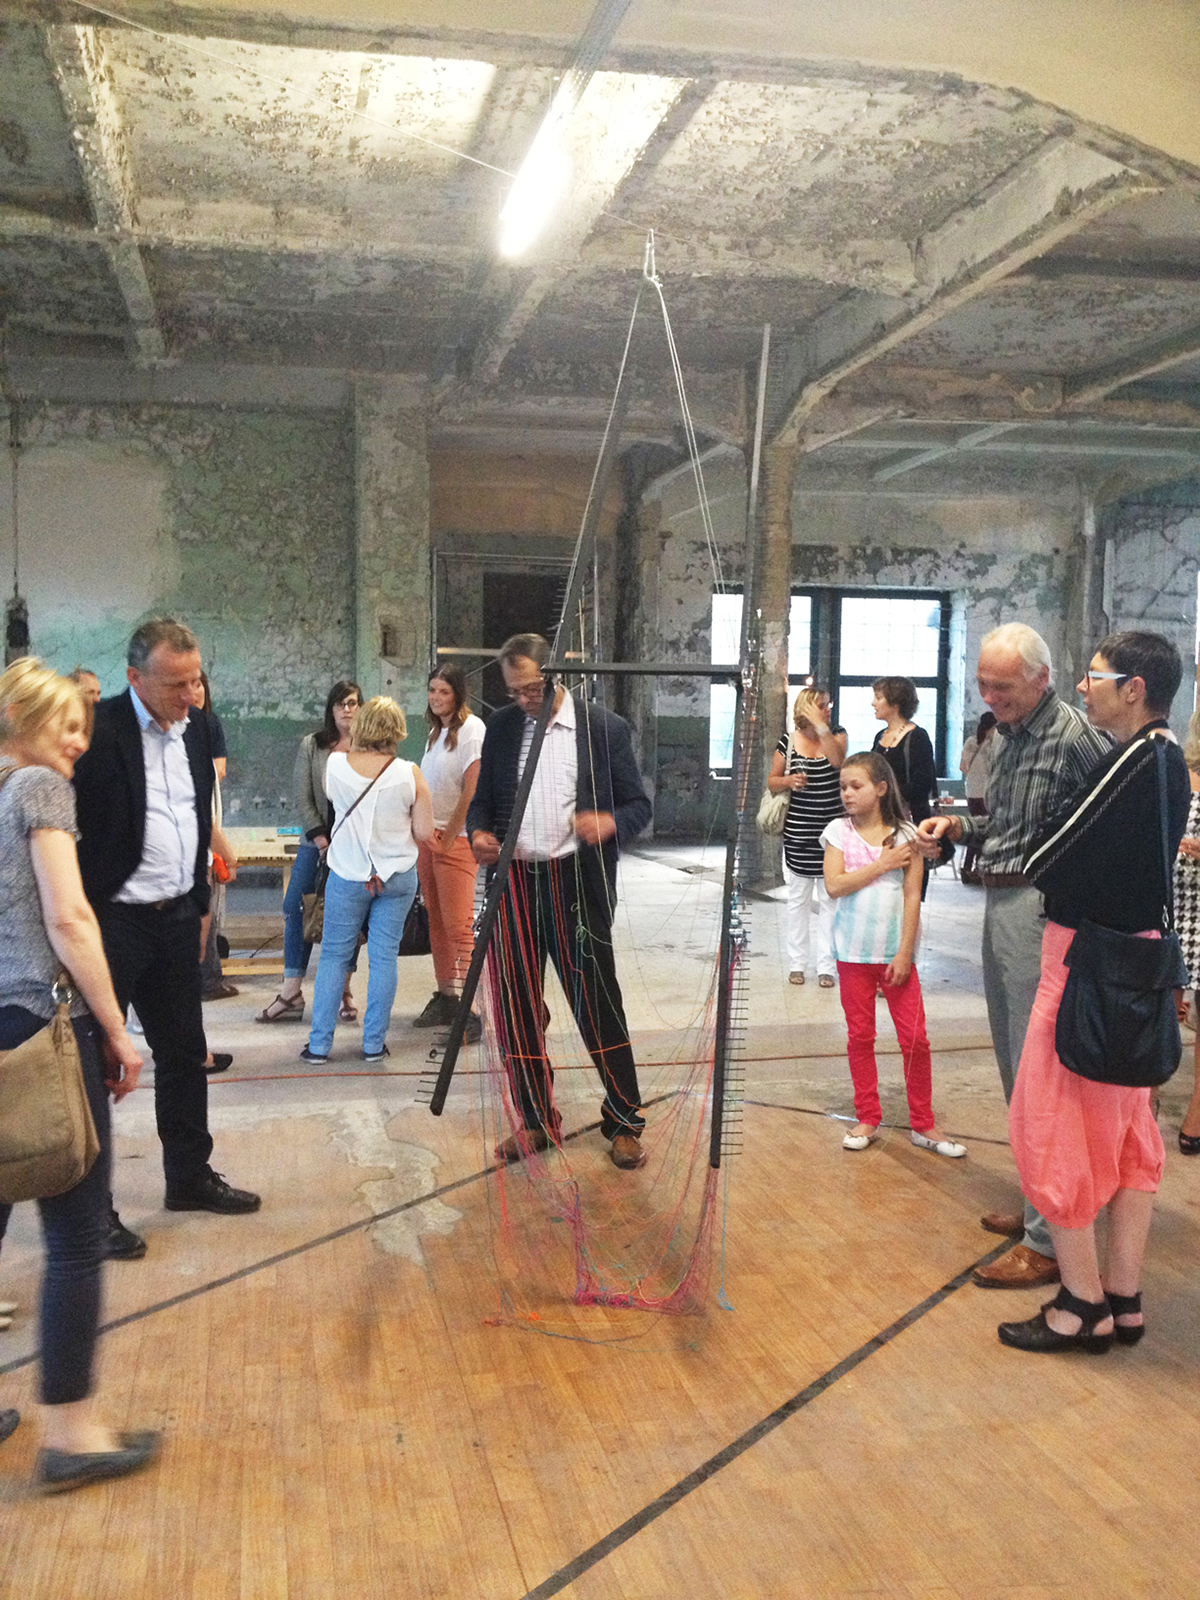
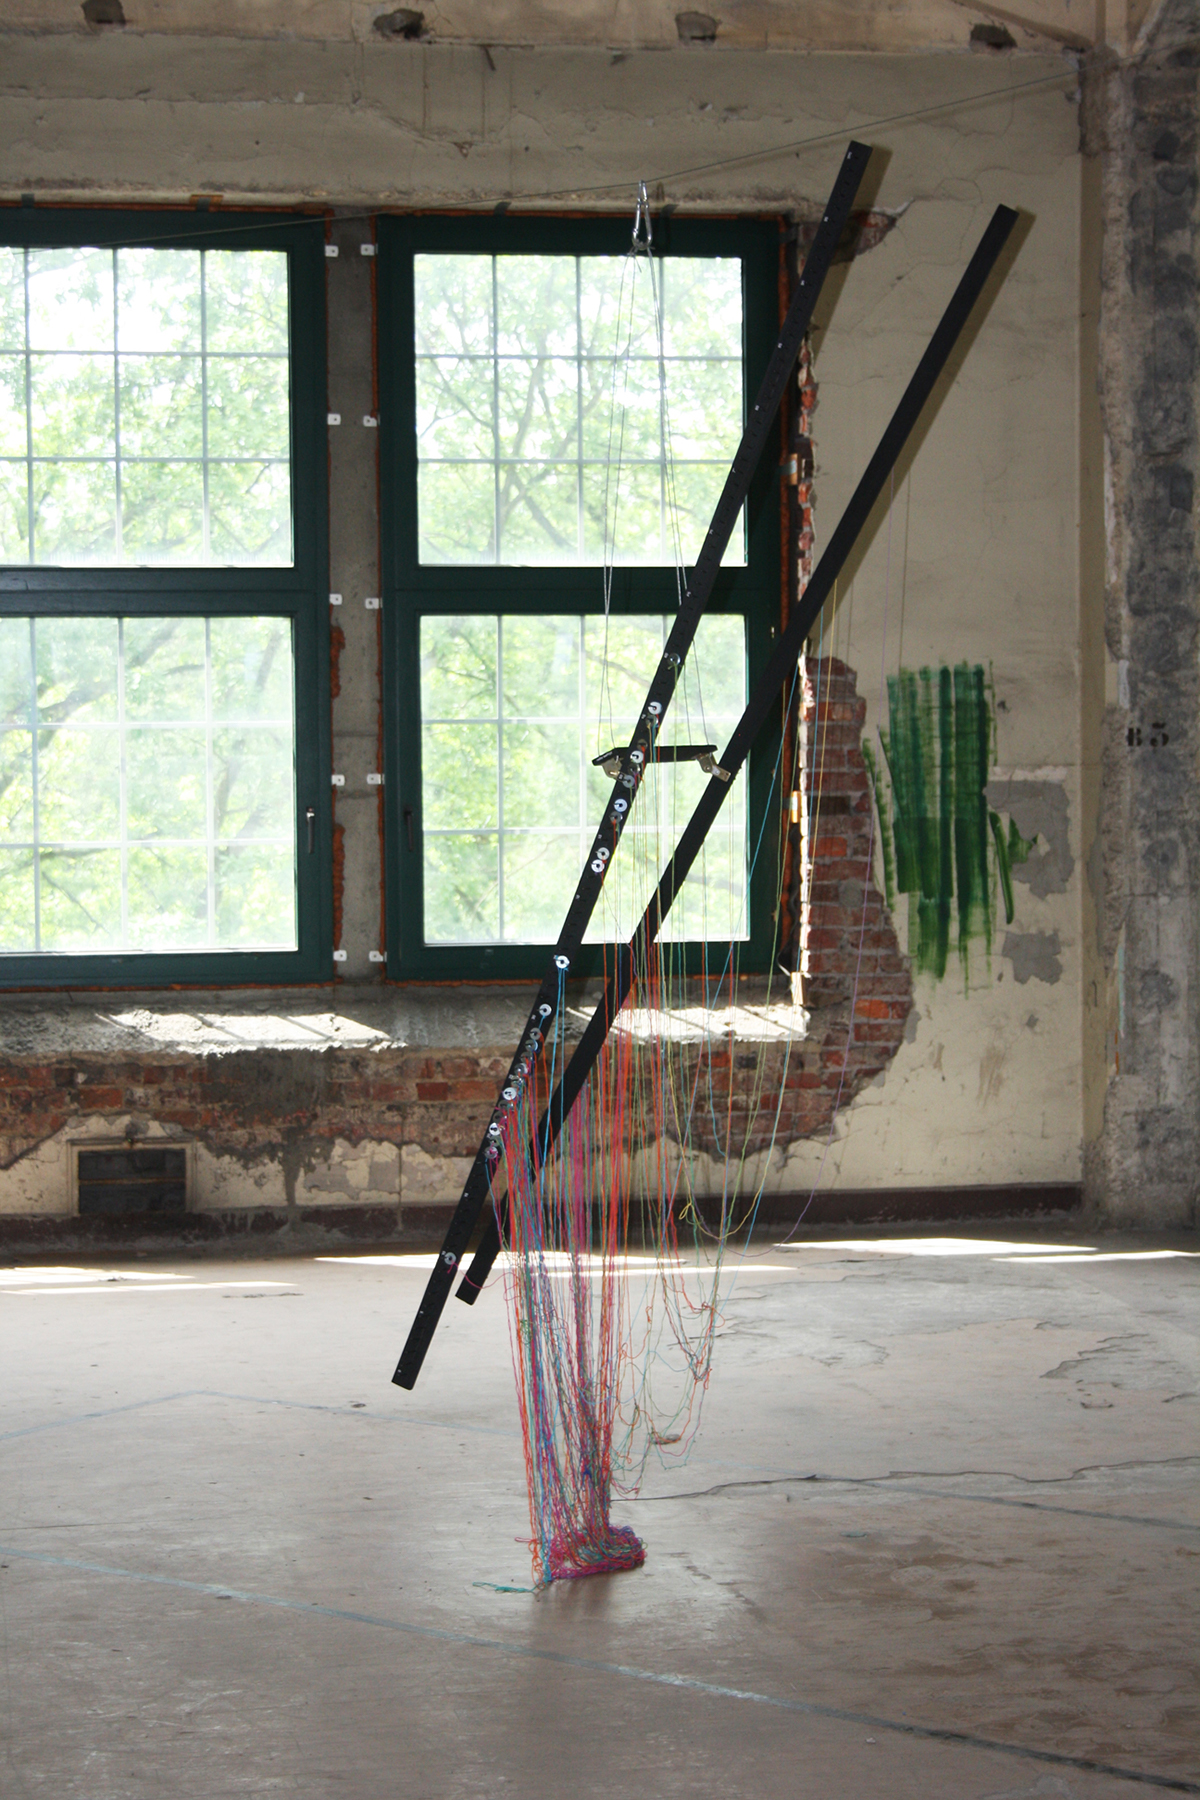
Because of the hingeable construction, the installation will be lower on the side where most of the strings will be attached.
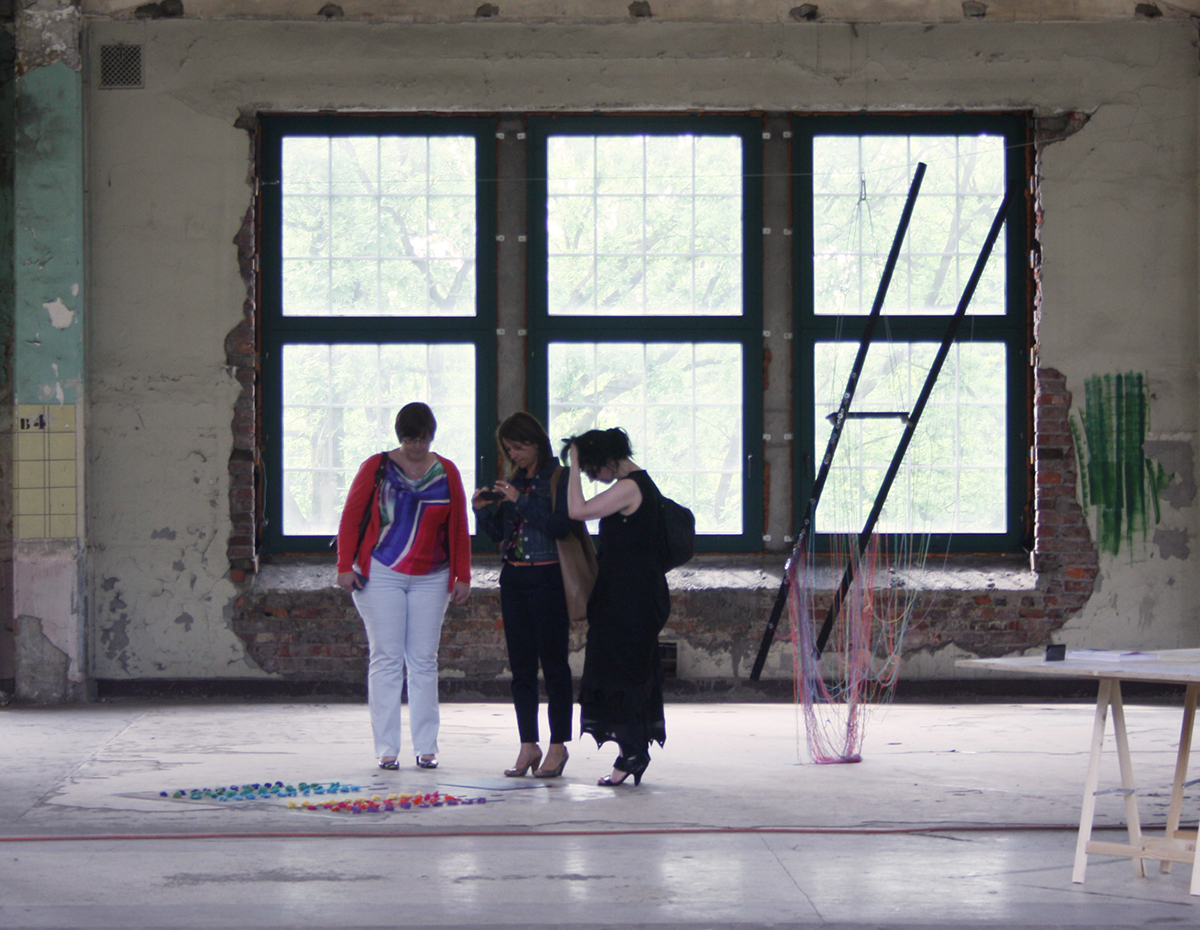
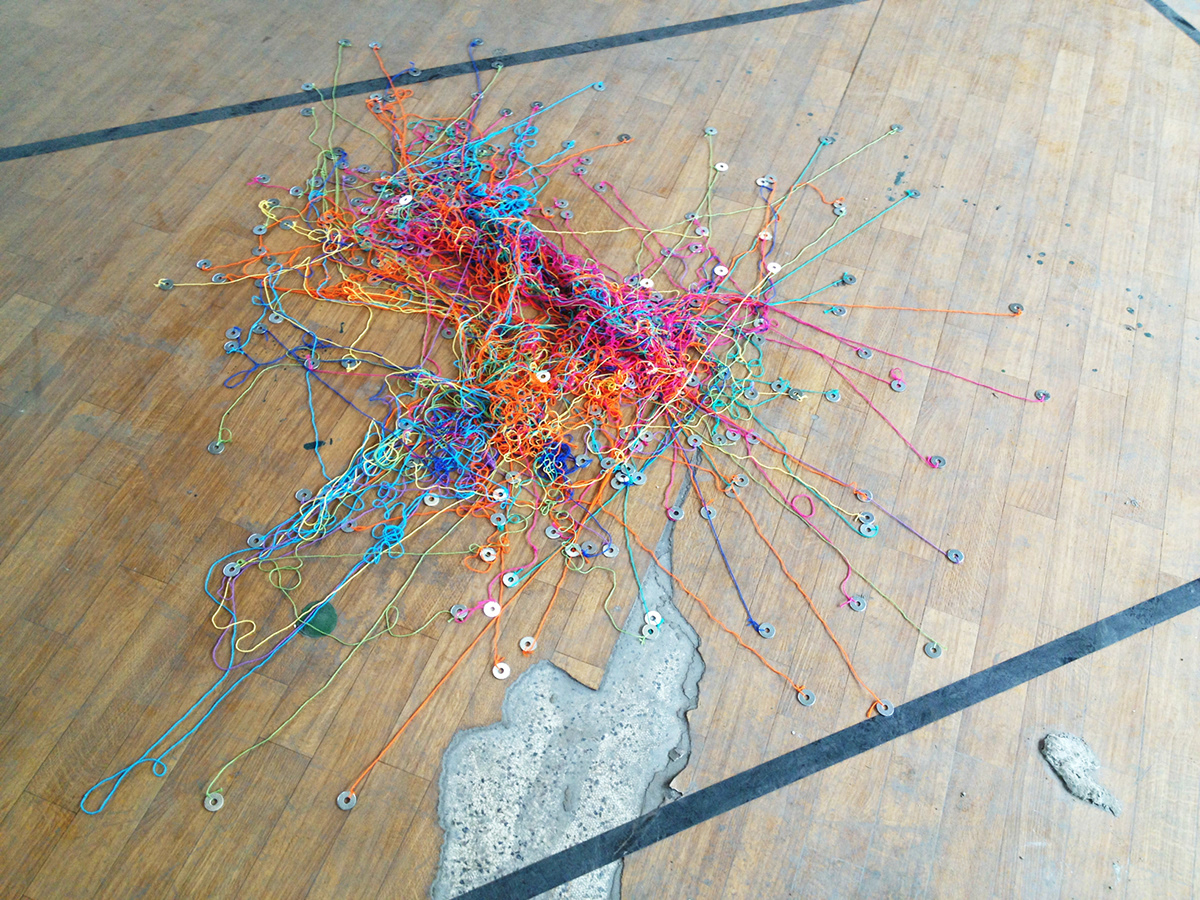
In this way a web full of data will be created.
Event: Exit/13 (exhibition master graduates, MAD-fac, Genk, Belgium)
Location: former mining building, Thor Park, Waterschei, Genk
"I'm actually quite happy with my age, but I would like to be a few years younger"
Participants: 144
Female: 57%
Male: 43%
Average real age: 31.8
Average preferred age: 29.5
Youngest participant: 5 (preferred age: 15)
Oldest participants: 79 (preferred age: 58 and 76)
Female: 57%
Male: 43%
Average real age: 31.8
Average preferred age: 29.5
Youngest participant: 5 (preferred age: 15)
Oldest participants: 79 (preferred age: 58 and 76)
People are in general quite satisfied with their age. The difference between the real and Preferred age was rarely more than twenty years. The discussion about the ideal age is still very interesting.


