This infographic was designed for David McCandless'Information is Beautiful Hollywood Visualizations Datavisualization Challenge. This infographic received First Place in the Design Challenge and was the Challenge Winner in Infodesign at the Information is Beautiful Annual Awards.
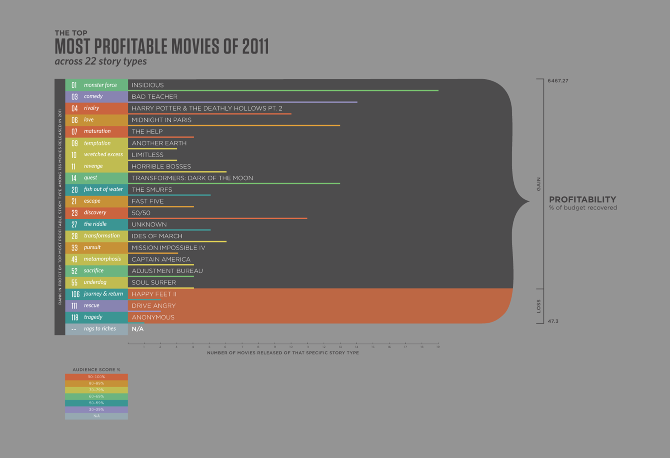
The brief asked designers to sort through an enormous dataset on Hollywood budgets, profits, genres, and review scores for every film from 2007–2011 and to visualize the interesting relationships that we find. I chose to explore the top most profitable movies of 2011 across 22 story types.
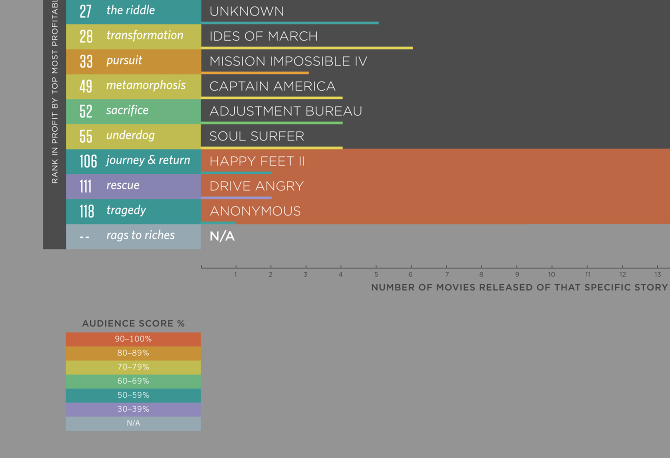
The movie's number signifies the rank in profit across the 136 movies released in 2011. Each movie represented is the most profitable in its story type category and the horizontal line equals the number of movies released of that specific story type of that year. The the differing colors reflects the audience score, while the vertical bar to the side represents the range in profitability from loss in the red and gain in the black.
The brief asked designers to sort through an enormous dataset on Hollywood budgets, profits, genres, and review scores for every film from 2007–2011 and to visualize the interesting relationships that we find. I chose to explore the top most profitable movies of 2011 across 22 story types.
The movie's number signifies the rank in profit across the 136 movies released in 2011. Each movie represented is the most profitable in its story type category and the horizontal line equals the number of movies released of that specific story type of that year. The the differing colors reflects the audience score, while the vertical bar to the side represents the range in profitability from loss in the red and gain in the black.