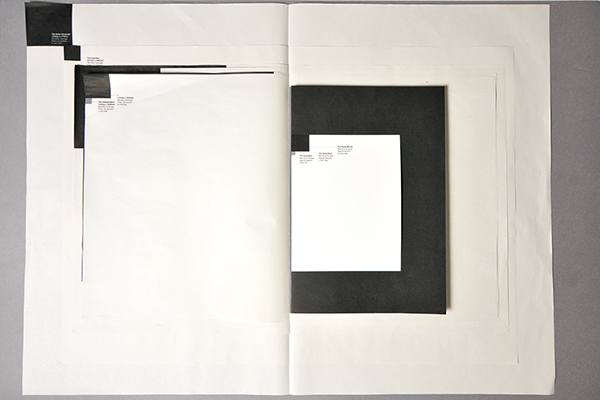

This information graphic was the outcome for my final major project proposal. It looked at how we consume information from the various news platforms (Web, App and Print).
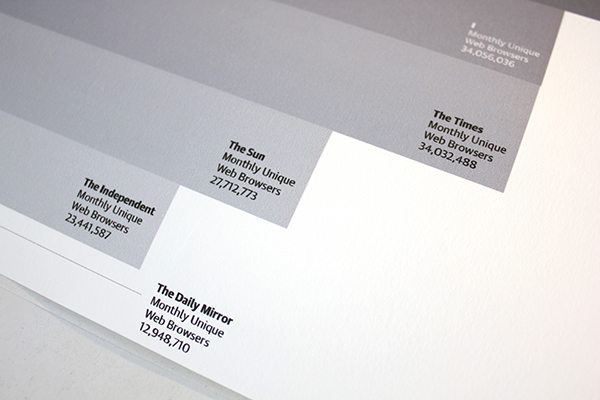
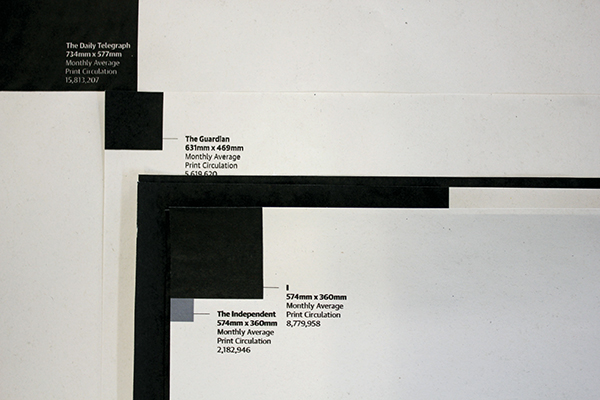
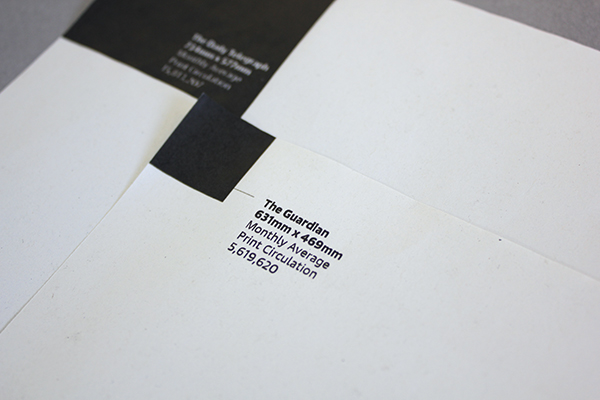
I looked at eight British news groups that had data for web and print as a minimum. I then represented this data for the news platforms as an information graphic which reflected both format and data.
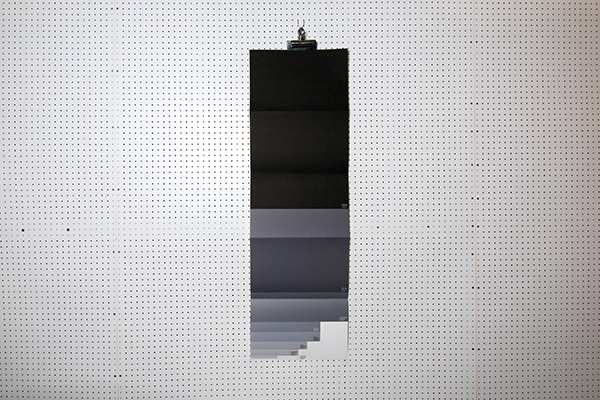
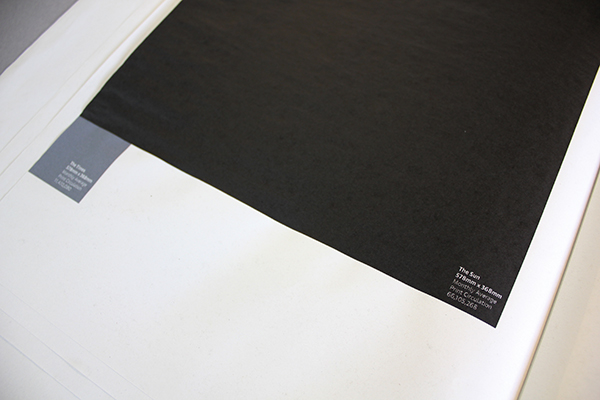
The data was represented by squares as the main focus was digital information, aka pixels. Each block of data is created from a group of 0.2mm x 0.2mm squares, which represents a value of 50,000 people.
White, black and tones of black were used so as to only communicate that this is raw data.
Data found at NewsWorks.org.uk.
Paper: 45gsm Newsprint
Size: Varies by newspaper
Paper: 200gsm Fabriano Academia Bianco
Size: 1063.55mm x 333mm (Web data)
Size: 199.3mm x 149.35mm (App data)
Method: Single sided large format inkjet
Size: Varies by newspaper
Paper: 200gsm Fabriano Academia Bianco
Size: 1063.55mm x 333mm (Web data)
Size: 199.3mm x 149.35mm (App data)
Method: Single sided large format inkjet
Binding: Non-stitched