
South Africa Office of Tourism //
World Factbook WIP
World Factbook WIP
What follows is process work for the South Africa Office of Tourism World Factbook, an 8.5x11 coffee-table style book meant to remind viewers of their trip to South Africa and the special memories made through it. Text from the book is sourced from the CIA World Factbook, but the look and feel of the book should be cohesive with the brand guidelines as well as other collateral made for the brand.

Setting up the template for the book in InDesign, using Blurb.

Making a document just for text from the CIA World Factbook. When pasted from the website, the text took up about 11 full pages. Now, have to go through the copy and pull out footnote markers and old dates that aren't supposed to be there.


Began mindmapping some design and purpose ideas for the book. Revisiting my persona, newlywed couple Tom and Peter, is important to me, while also showing South Africa through an authentic lens that is sure to remind viewers of the unforgettable experiences had on their trip.

In beginning to build my design inventory, I knew the best person to reach out to first, and fortunately, they're my family. My cousin, Lindsay, met her husband, Jaques while living in South Africa, and they eventually had a daughter, Alice. Jaques was born and raised in Johannesburg, but lived in Durban most of his life. Although they settled in the states, they visit South Africa frequently to see Jaques' family. Jaques was excited when I mentioned this project to him, so I reached out looking for a few photos to use in the factbook to substitute the typical stock photography.


Luckily Jaques was super helpful in sharing photos. In fact...
...he shared about 300 of them! Scrolling through these, I am so excited to not only provide some visual language to describe the beauty that embodies this country, but to tell a story—one of love, family, and adventure for all. And I believe Jaques' story is one that many will resonate with, especially viewers like Tom and Peter.

First moodboard of my favorite images sent to me so far by Jaques. I know I definitely want to show the beauty of the country through a local's eye, which includes both landscape and lifestyle shots.

Second moodboard of textures and patterns that really stick out to me when thinking about the factbook. One thing to note is that any texture/pattern use will be within my designated color guide, instead of the bright, rainbow tones seen here.

Third moodboard with some preliminary thoughts on data visualization. I'm sure this board will grow over time as I get deeper into my designs and begin looking for other solutions. The thoughts so far? Simplicity and innovation. Something as simple as a basic pie chart, but upped a little bit in creativity. People come to SA because it's easy to travel; people speak English and transportation is straightforward. Your vacation isn't complicated, so the data shouldn't be, either.

Sketches for factbook cover and back cover. Planning on using Jaques' photos (particularly the ones of the plane or the coastline) to do so, and incorporating pattern in with the photo.

Hoping to spotlight one of South Africa's most unique traits in the chapter/section pages within the factbook: the fact that it has 11 official languages. These sketches experiment with including all 11 translations with the section body copy in a cohesive manner.

Began to experiment setting up one of the most text-heavy spreads of the book: SA History. I'd like to try and communicate it through a timeline, rather than a block of text, so I'm trying out different solutions to the timeline here. Should it be a literal line, in the form of a photo or vector pattern, or should it be just a suggestion of a timeline, keeping the integrity of the grid?

I took what I had sketched last night and decided to start laying out the order of the book, in order to give me an idea of how many pages each topic would warrant, and the amount of information per page. After doing this, I know I'm not done with research, but I'd like to dive in to designing and laying out spreads in InDesign so I can take a full inventory and know which topics to research more.

Beginning to set up master page in InDesign. I went with larger top and bottom margins to mirror my brand guidelines, with slightly larger gutters. I decided to keep the same margin notes for now, but might add to this later.

Starting to put my sketches into action, starting with placing text. I went through and formatted each headline, and pasted the sections of text from my text document in their respective pages to get an idea on the amount of information. Immediately, I was slightly intimidated on the sheer number of paragraphs in sections like History and Economy. I definitely foresee having to rethink those spread designs based on the amount of text. I also started experimenting with the '11 languages' design. This also caused some trouble.

When in doubt, make a spreadsheet, right? I figured that before I started seriously delving into that design, I should be clear on which pages I was utilizing it, and if I had the information I needed for it. To help keep translations straight and visualize the information from a larger perspective, I threw them into a spread sheet. Gathering these translations was difficult - especially for the less popular official languages. This step took a long time, but I'm glad I did it earlier rather than later. Next, I'll be formatting type and placing some preliminary photos.

Finishing up my research, I started thoroughly looking for examples and ideas for data visualization and infographics. I know I want to communicate South Africa's history through a timeline, so I looked at how other designers approached this technique in a visually appealing way. One thing I'll need to be conscious of is the sheer amount of text that comes with this section, and how to break it up carefully.

I also plan on incorporating a visual to accompany the geography data, so I looked at examples of map infographics and visuals. I like the illustrative qualities of these, and I think this style would compliment my patterns and illustrations in an interesting way.

Finally, I looked for general examples of data visualization and infographics to use on sections like Economy, People, and Transportation. Some of the important aspects of these selected visuals are the handling of large amounts of text, and incorporating multiple data visualizations in one spread. These examples will be helpful to look back on when I begin designing data-heavy spreads.


Doing some in-depth sketches for chapter transitions, including pattern and texture rather than simply type. I feel much more creativity in these, but not sure introducing this new texture is the way to go. I will continue to experiment. Next, I'm going to jump into Photoshop to start experimenting using photos, as well. I really want these transitions to stand out and encapsulate the heart of the book, so these need to be perfect.
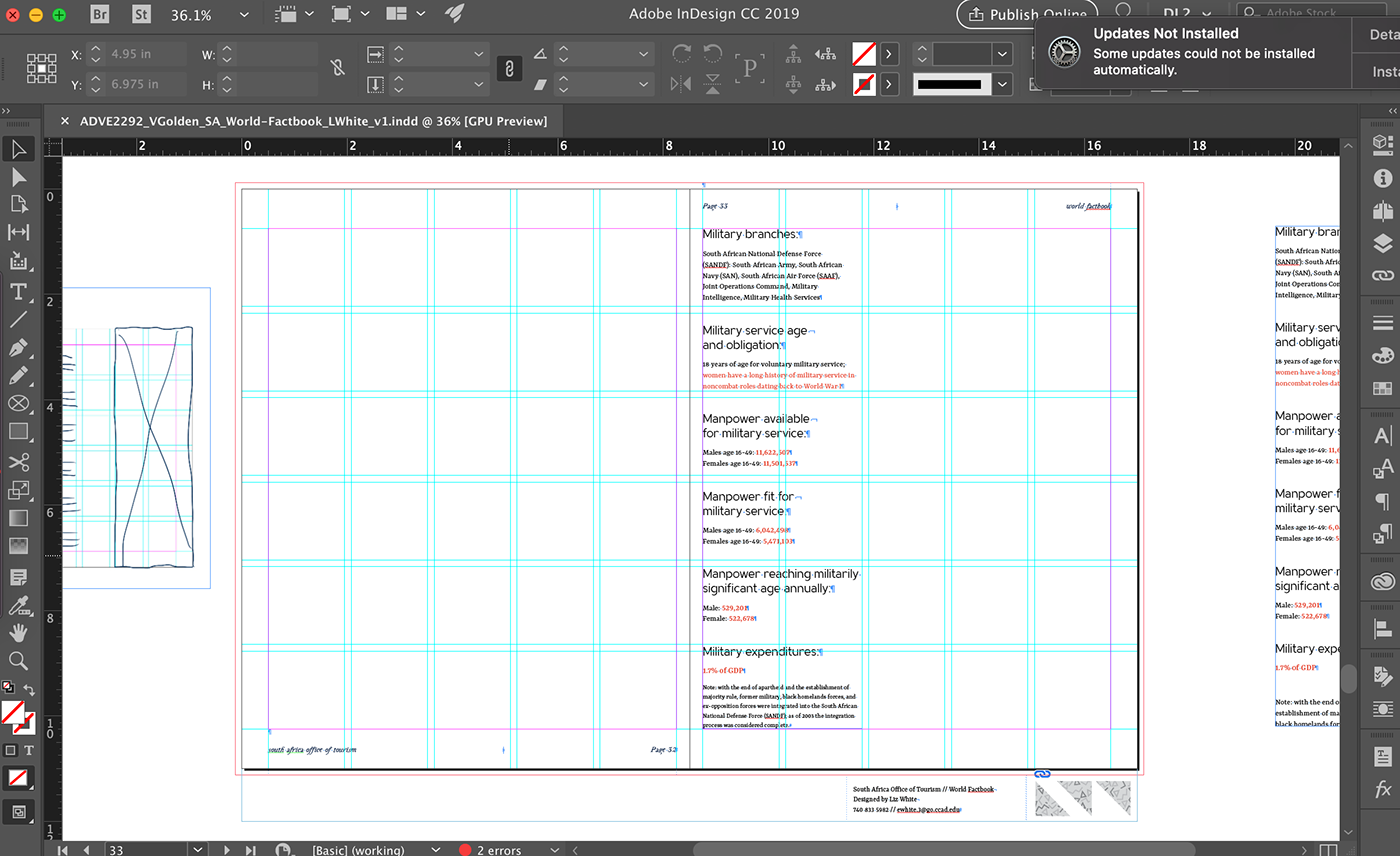
Spent this weekend working out my text, placing it on the page and beginning to format it. After speaking to a friend, she recommended that I start with formatting the statistics, as they tend to be toward the end of the book. She told me that if I save the statistics for last, I'll get burned out by them really quickly. So I began working with the stats, and making paragraph and character styles to format them in interesting ways while keeping consistent.

First spread for the Economy section. This page will include a small infographic of stats, although, after placing type I'm a little worried about the amount of space I have to work with.

Spread for the Culture section. I love working with dense pieces of text like this, because its a challenge getting the format exactly the way you want, while also keeping it fun and interesting.

Spread for Transnational Issues. Another challenging, but fun design. I'm planning on applying an interesting, reverse/transparency on the information from the right page using a photograph. Why haven't I placed any photographs yet? Because, as I've learned from the brand guidelines and mailer, they slow down my computer to the point that I have difficulty scrolling from page to page on the document. Fun!

Transportation and Communication spread. Planning on making these stats into an infographic, so thought it would be best to at least format the text until I can integrate it into the visual.


