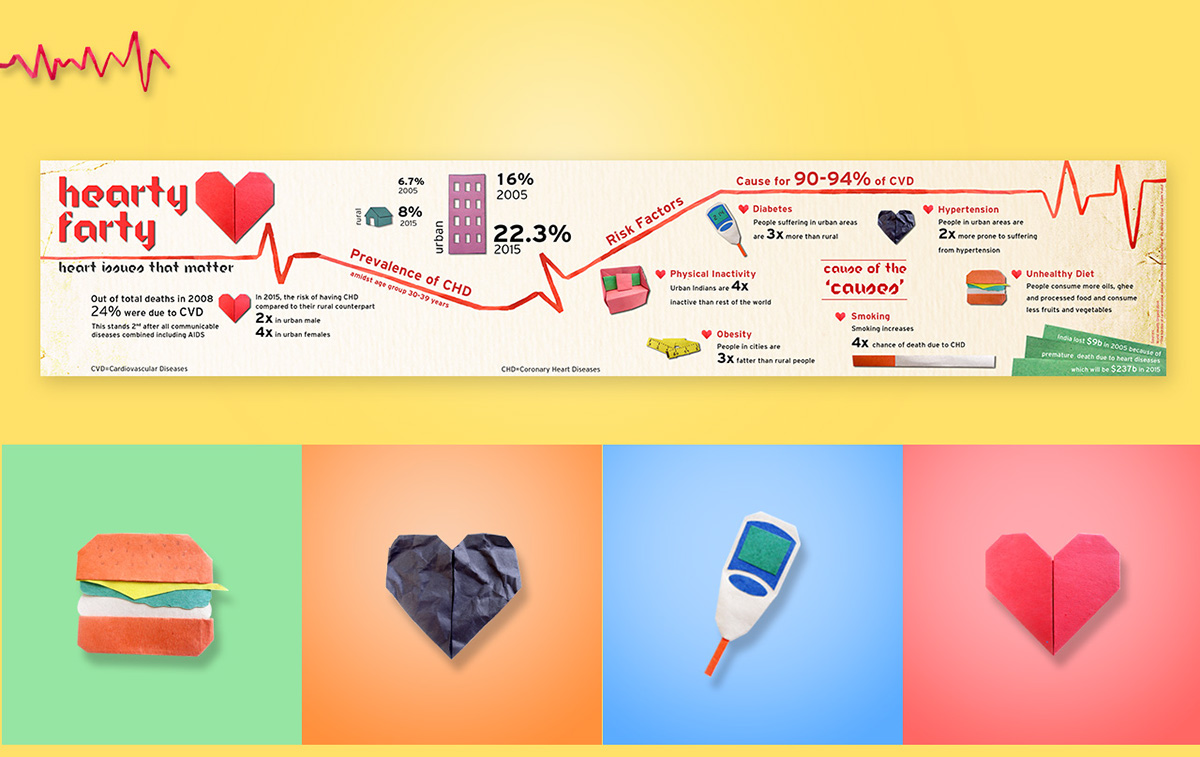
Recently attended the Visualizing Marathon organized by visualizing.org in New Delhi on the 2nd and 3rd of March 2012. From a given data set on Cardiovascular Diseases in India, me and my team came up with this infographic. Our approach to this was to keep it simple to understand and as pleasent to look at. To create the icons we used paper and origami and created objects, photographed them and used them right at the event.
To see more details and actual infographic on visualizing.org CLICK HERE
To see more details and actual infographic on visualizing.org CLICK HERE