Earthquake Fault Infographic
Print of Fault Line Activity in the Bay Area
Print of Fault Line Activity in the Bay Area
Project Outline:
Design a Bay Area Earthquake Incident Map for approximately a portion of the month of November 2011. The information should be easily accessible in both macro/micro views.
Design a Bay Area Earthquake Incident Map for approximately a portion of the month of November 2011. The information should be easily accessible in both macro/micro views.

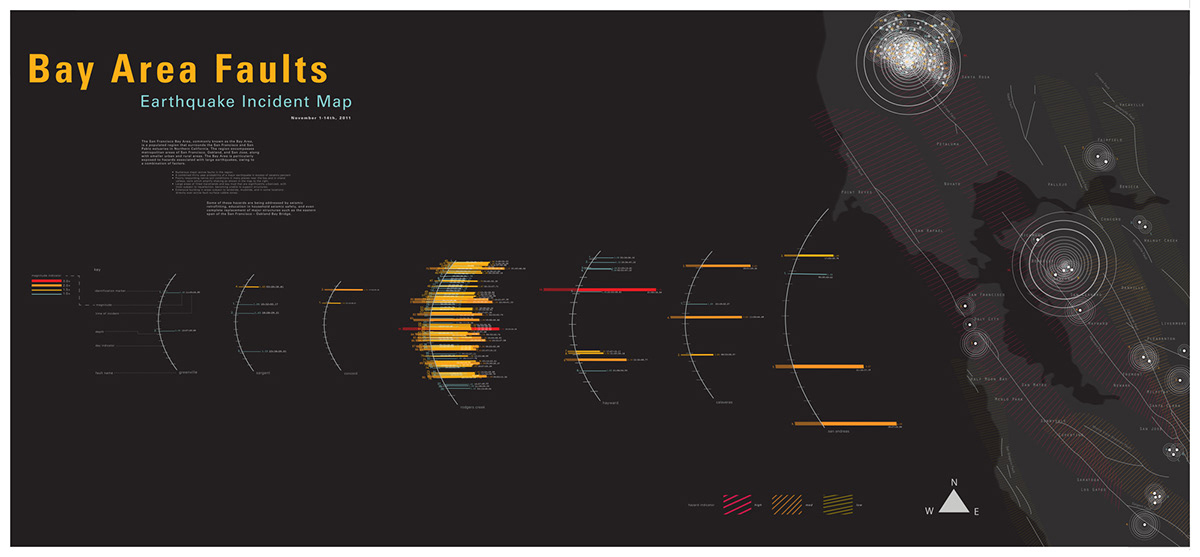
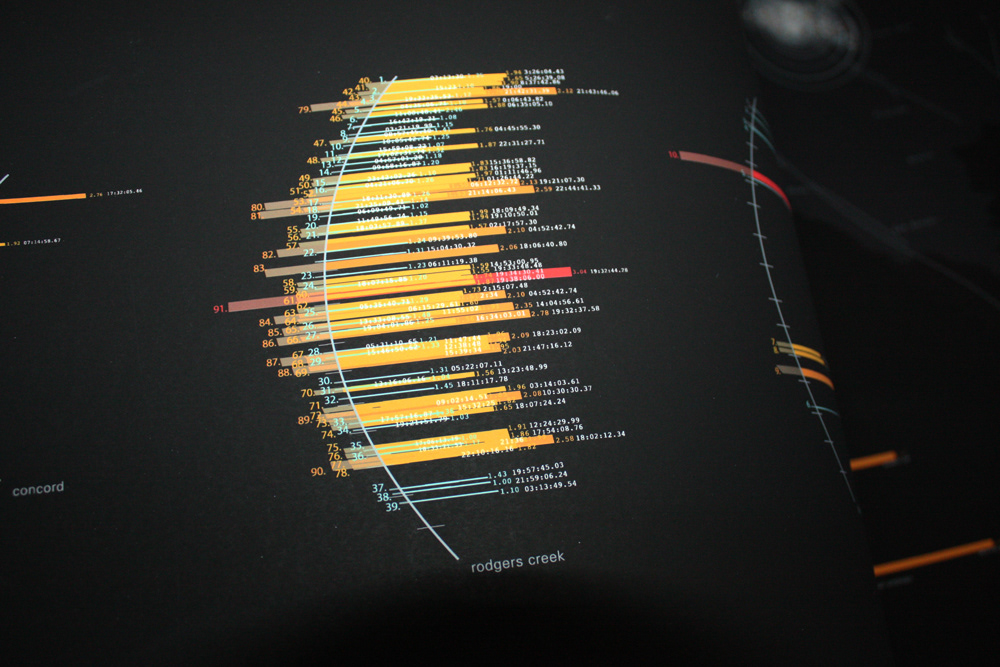
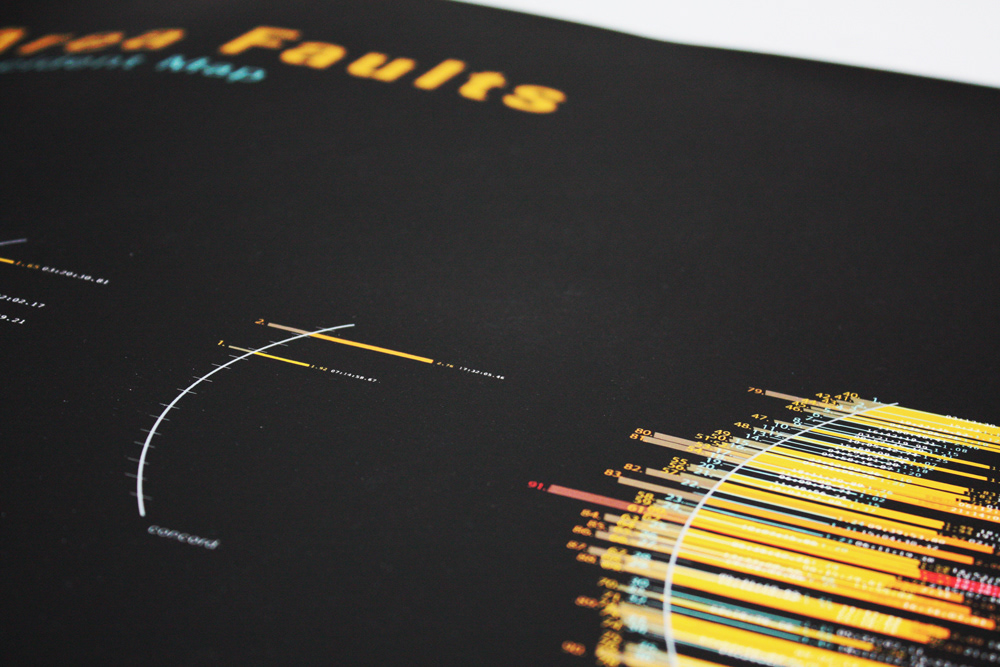
This large infographic is 36 inches x 25 inches. The infographic shows every incident in a two week period during November, in the California Bay Area in 2011. Fault lines are also illustrated, as well as the zoning for danger. Each fault line is examined in depth during the two week period, showing the depth, magnitude, the time and placement of every incident.