La Lettura, Il Corriere della Sera
Climate change, climate risks
/ July 30, 2023
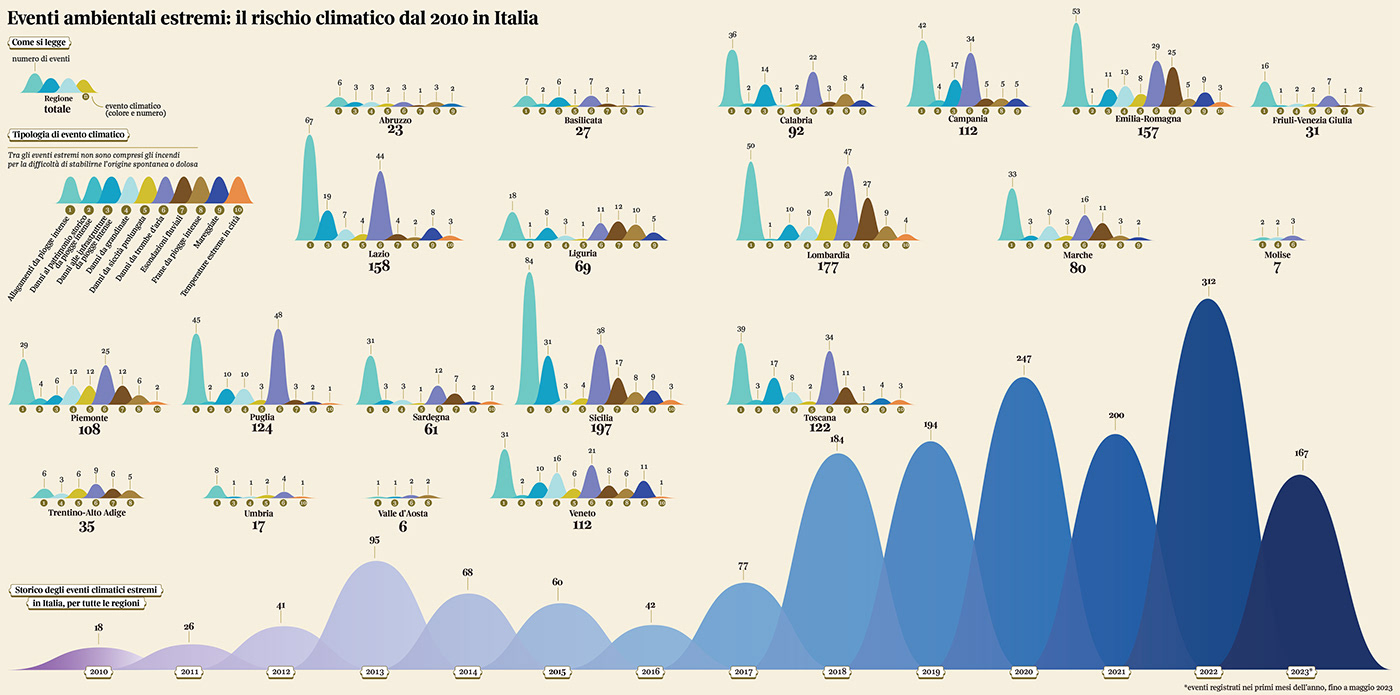
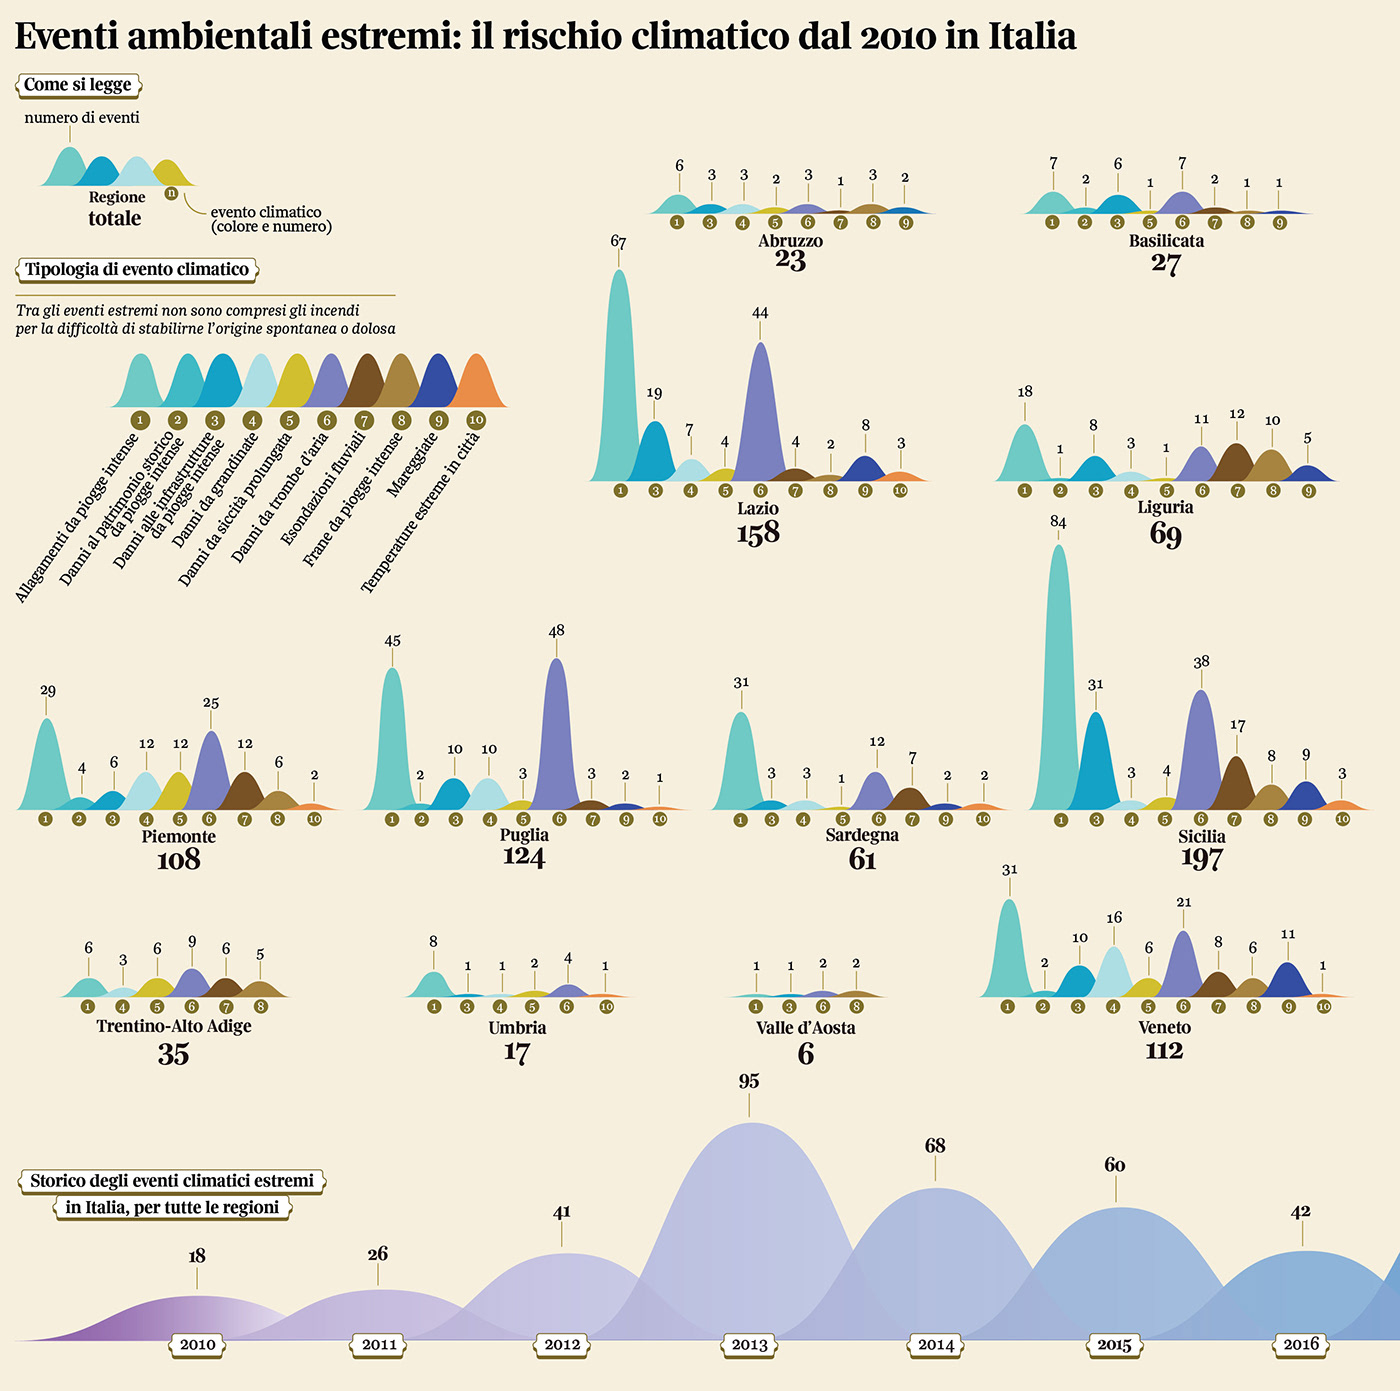
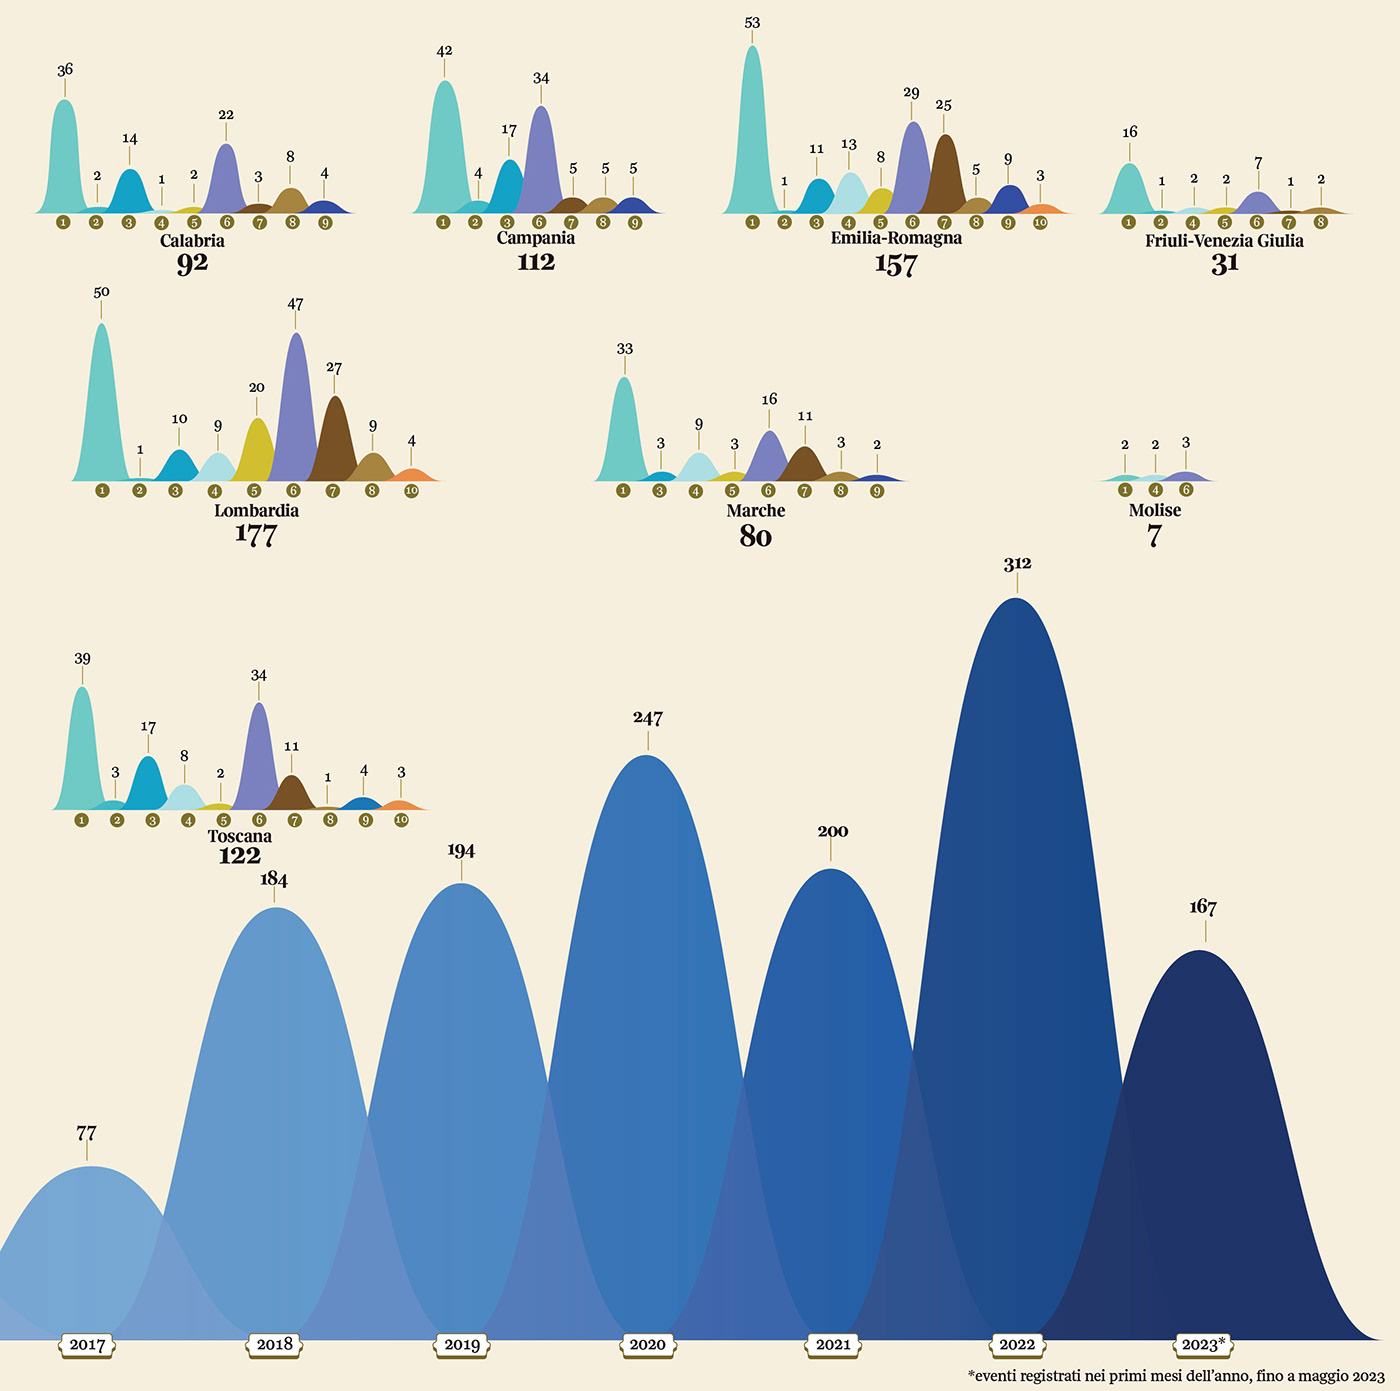
This visualization shows all data of extreme climatic events that have been affecting the Italian territory during the last decade. For each region are shown in different colours the typology and number of events that have occurred. The graph at the bottom gives a complete overview of all climatic events per year and it clearly highlights the rising of extreme events from 2010 to the first months of 2023.
Source: cittaclima.it, Legambiente